↓
 

The Spellman Report

The Spellman Report, Where the Economy and Markets Meet

The Spellman Report
  • About
  • Blog
  • News and Views
  • Video
  • Investment Management
  • Speaking Engagements

Category Archives: The Spellman Report

Post navigation

← Older posts

Déjà Vu All Over Again: Today’s Suspicious Looking Stock Market

yogi berra, The Spellman Report,

This year has seen high after new high in US stock price indexes and this comes on top of a run that dates back to March, 2009. There was a time when rising stock prices with or without rising earnings would attract a crowd of eager investors wishing to join the momentum.

But today, like so much else in economics and finance it seems to be working upside down and backwards. As the WSJ recently put it, “Earnings drive latest (price) leg, but money has been flowing out of stock funds.” While, it’s hard to image rising prices if money is actually flowing out, but judging from today’s anecdotal comments, confidence is certainly flowing out.

So as Yogi Berra, the erstwhile New York Yankee catcher and the King of malapropisms would likely ask, what Déjà Vu All over Again are investors seeing?

Well today’s baby boomers, with the majority of investable wealth, have been around long enough to have lived through the tech boom and bust, the dot.com boom and bust, the oil boom and bust and don’t forget the housing boom and bust and that’s within the past twenty years. And there are more as there have been 11 post-WWII cyclical recoveries that end in the next recessionary induced dips in stock prices.

The signaling device they are employing seems to be stock price prosperity is followed by recessionary events and if not, surely falling equity prices. Stock market enthusiasm has become a signaling device to get out and historically there is some justification.

This mechanism has occurred many times as cyclical expansions ultimately become more expensive for producers to produce additional output and hence reduces profit margins and total profits. This would occur when labor becomes scarce and expensive while worker output at the margin declines when adding labor faster than machines. The implication of rising wages and poorer labor productivity at the tail-end of a cyclical expansion is an increase in the cost per unit produced hence depressing profit margins and total profit.

So cyclical tail-end expansions have been the breeding ground for stock market reversals and many stock market “veterans” of this phenomena are reliving the nasty experience.

But funny things are happening these days so this might not be typical at all. After the weak but lengthy cyclical expansion from the depths of the Great Recession, earnings are not declining for the leading and most highly weighted areas of the market. At least judging from the last two quarterly corporate earnings reports both profit margins and total profits are generally rising.

This is not the usual happening at this stage of the cyclical expansion and to boot we are not getting the usual late cycle inflation when producers try to pass along the higher costs of production to consumers in the form of higher prices.

Instead, inflation keeps going lower and lower.

So we have a mature cyclical expansion but yet rising profit margins along with declining inflation!

So how can that happen?

Well, let’s see…The backbone of the “typical” expansion is a demand driven uplift with relatively slow motion improvements in supply capability. Today we have the opposite. Supply capability is moving forward faster than demand so markets clear at lower prices. Such a condition would be more visible and recognizable if the supply capability were the result of some new and improved technology with a substantial viewable physical presence as it has been in other episodes of revolutionary economic change. These are often referred to as creative-destruction episodes which in today’s parlance is being called disruptors and the disrupted.

The leading historical examples of the creative episodes is perhaps the steam engines era of the 19th century. It was first applied to shipping, then to the “iron horse” locomotive and then to machinery driven production. Another great transformer to production and efficiency was electricity being the driving force of assembly-line production and yet another was the internal combustion engine that relegated the horse and carriage to the scrap heap of transportation.

A more recent example is the “tech boom” that started with the large mainframe computers and branched out decades later to the personal computer.

And now the creative-destruction process is flying under the radar screen via the now ubiquitous but unimposing handheld device most every consumer carries in their pocket and enables the user to search the globe for the best deald possible and have it shipped to them.

This is a bona fide reason for supply curves in so many industries to be shifted downward and outward generating lower market clearing prices along with higher profit margins. In this case the lower business costs are due to economies in marketing, distribution and payments.

The new tech that is reshaping businesses and business efficiency is perhaps best explained by what was describe to me as a joke. Well, you decide whether it is funny!

A pizza customer calls his favorite local pizza parlor and asks: “Is this Mike’s Pizza?

Pizza Operator: “No, sir, we are now Amazon Pizza. Do you want your usual”?

Customer: “How do you know my usual?”

Amazon Pizza: “Well sir, our records indicate you ordered pizza with pastrami and thick crust for your last seven orders. Do you want that?”

Customer: “Well, ok”

Amazon Pizza: “Sir, could I suggest you add some vegetables, this time”

Customer: “Why do you say that, I hate vegetables?”

Amazon Pizza: “Sir, by cross matching phone numbers we find that your medical records indicate you have a cholesterol problem.”

Customer: “I don’t need vegetables, I take anti-cholesterol medication”

Amazon Pizza: “But sir, we see that you have not reorder your medication in 4 months”

Customer: “To show you how much you know, I recently purchased over- the-counter cholesterol medication.”

Amazon Pizza: “But sir your credit card shows no such charge.”

Customer: “To show you how little you know, I paid in cash.”

Amazon Pizza: “But sir, your bank account shows no cash withdrawals in some time but our location finder on your IPhone indicates you are at the corner of 4th and Main and our drug distribution center is only a half a block down Main. Would you like me to order the medication to be ready for your arrival?

Customer: “This is too much. I am being hounded and spied on. Where is my privacy? I want to leave the country!”

Amazon Pizza: “Sir, I’m sorry to inform you, your passport expired five months ago, but if you go on our web site and click “Renew” we can have it processed and delivered to you within 5 days for only $50.”

This is marketing and distribution in revolution. Go on either Amazon or a search engine such as Google and do a search for a totally generic item, like aspirin.

Well the aspirin producers pay for being at the top of the list and this is not a revolution in production or product development but in marketing, distribution and payment, which are significant business expenses. The manufacturer cuts costs and increases profit margins and the third party online delivery service generates profit for performing these functions.

And recently, Amazon has applied in twelve states for wholesale drug distribution licenses and the Wall Street reports it is in talks to purchase a major drug retailer to drive the buying to their own outlet for another slice of the profit. It won’t stop at Whole Foods!

So your IPhone started out to be a revolutionary way to keep track of your kids but now it’s become the means by which your suppliers keep track of you and all your tastes and wants and payment means. This is called “big” data.

This is a marketing and distribution revolution. There will be survivors of the changes who will profit from them and there will be new devises (and their producers) such as driverless cars, lockers, and drones that will do the actual distribution.

Books, newspapers, music, golf lessons and education have already been impacted as content is delivered via your handheld device leaving many traditional purveyors out in the cold. And those left out are seen on the landscape as it includes traditional retail shops and the shopping malls they inhabited.

We are only at the beginning of sorting out who will be the successful disrupters and which of the disrupted face extinction in this new industrial revolution— but stock investors placed with disruptors will be the real winners here.

So who will those winners be? As the great Yogi Berra said, “It’s tough to make predictions, especially about the future.” But we know that the disruptors are adding to and redistributing profit at this late stage of the housing cyclical recovery and its generating fresh enthusiasm for the stock market outlook.

A Summary of the Great Disconnect Series

total assets of major centralbanks

In September over three evening I presented a trio of lectures regarding why financial pricing has been exuberant as compared to a slow growth economy. The videos of the slow growth economy discussion can be found HERE. And why the exuberant pricing is linked HERE. The third evening was a discussion of the current investment dilemma especially for Baby Boomers with the need for asset accumulation and investment income in these extended financial markets. The video of that discussion was not preserved but I provide the power point outlines here:

Spellman Power Point Lecture 1 The Slow Growing Economy

Spellman Power Point Lecture 2 Market Support

The Baby Boomer Dilemma Power Point

A decade has passed since the onset of the Great Recession.

The economic policy response has been Keynesian in the extreme. Fiscal policy, which is debt-financed spending, caused government debt outstanding to double over that time period from $10 Trillion in 2007 to $20 trillion in 2017. Shockingly, it took 217 years to accumulate the first $10 trillion of debt and then only a decade to add another ten trillion.

Monetary policy was also pushed to an extreme, first to reduce policy rates to near zero, which had never been done before, and thereafter to purchase a targeted amount of assets, irrespective of the prices paid. To the extent monetary policy leads to higher private spending levels it is via generating debt-financed spending which supposedly is enticed by the lower costs of borrowing. Regrettably, relatively little of that occurred.

The Keynesian medication to cure the economic ills of the Great Recession was applied in the extreme. It left us with the side-effect of higher levels of debt and hence high debt service relative to income. Less was left over to spend on goods and services, which should have given rise to the next round of income generation. Also, the higher government debt load caused higher taxes to service the interest. About half of the interest was lost to our income stream as it was, and is being paid to foreign owners of US government debt.

This by itself would slow economic growth but the malaise was further accentuated by the ongoing deficit in the balance of trade with the rest of the world. These imbalances during the Great Recession decade ran at approximately -3% per year for goods and services.

Taking all this into account, the fabled fiscal “multiplier” of spending from a dollar of borrowed money has seemingly dwindled from the theoretical textbook version of 5 times the original borrowed and spent amount to less than 1.

As a result, over the decade of the Great Recession, a dollar borrowed and spent by the government generated less than a dollar of total spending and income. The consequence is that we piled on more debt than income to support it, year-by-year during the Great Recession and continue to do so. The US is now at the highest historic debt to income ratio both for government debt alone as well as for combined government and private debt to income.

So for all that extreme debt accumulation, relatively little translated into additional spending that would propel the economy forward and create jobs. The economy’s growth rate was sub-normal at 2% or less — which became known as the “New Normal” when compared to the US historic norm of a 3% to 3.5% growth rate in real terms.

This leads us to the question of the Great Disconnect Series. How did this slow growing economy generate elevated financial prices? It defies the common sense notion that the prices paid in financial markets will reflect the economic environment as it sets a general tone for the growth of corporate earnings and the risks that financial contracts will not be satisfied.

There is a linkage of financial asset pricing in this scenario but it is not the usual story of expansionary fiscal and monetary policy accelerating the economy’s growth rate and causing private parties to assign higher values to stocks and other assets.

In this Great Recession the ultra-expansionary monetary policy impacts were quite different. First, the banking system was still rebuilding its capital (net worth) from Great Recession losses and it was not much of a factor in ramping up bank lending.

Given that, the Fed sought to transmit lending to the private sector via capital markets. This needed to be powered home without a banking sector multiplier by setting quantitative amounts of liquidity to be injected into the capital markets. That is, the Fed buying provided the cash to bid up the prices of virtually all assets prices in global capital markets helped by an unanticipated foreign central bank multiplier that worked in the following way.

When a central bank engages in a large scale asset purchase program, which now goes by the name Quantitative Ease (QE), it typically purchases its own country’s bonds which are paid for by its currency. It is important to note, that those bonds are purchased on the secondary markets (not from the government) but from existing private owners of debt. The sellers are typically investment managers for large financial institutions and that is the key to understand what follows.

The private investment managers were enticed to sell government bonds to the central bank at a gain and the higher market price drives market yields downward. Now with cash in hand, the investment manager is in search of a replacement asset. Typically, the manager seeks other assets in the same asset category which is domestic bonds that indeed expanded rapidly as a result of the demand for like-kind substitutes. But when market prices are bid upward and market yields fall dramatically as they did, the managers begin to seek other categories of replacement assets with greater yield or total return prospects.

In this way the financial buying power spread to domestic equities, preferred stock, pipelines, REITs, etc. Indeed, the search for substitute assets widened to other countries and their financial assets as barriers to foreign capital flows have been eliminated so those markets are in play. This often makes foreign assets interesting replacement assets for the domestic investment manager.

But there was an unintended consequence to this chain of events.

When foreign capital descends on a capital market it first passes through the currency market and causes the currency of the recipient country to appreciate. This is the new dynamic of domestic monetary policy: it causes the recipient country’s currency and financial prices to appreciate.

You might only imagine the rub for the recipient country. The central bank that engaged in the initial QE drives financial spending to the recipient’s financial markets and caused its currency to appreciate and its bond yields to decline. Basically, the initial country in effect conducted expansionary monetary policy in the recipient country’s capital markets and with a more expensive currency is depressing the recipient’s foreign trade balance. After registering its displeasure and alarm, the central bank of the recipient county then felt the need to take actions to offset the foreign capital inflows.

The recipient central bank response typically has been expansionary monetary policy of their own with the logic of reducing its relatively higher interest rate to remove the incentives for foreign capital to be attracted to its capital markets. This intervention by the recipient country central banks leads to a generalized reduction of global interest rate and the reduction in the interest rate differentials. Some of these yield reductions have been extreme with some central banks pushing the market yield on its governments’ bonds to zero and below.

But to offset the impact of the initiator, the central banks of the recipient countries needed a sizable asset purchase as well.

This dynamic, of the initiator and the offsetting asset purchases of the recipient, has created a “global central bank money supply multiplier” from the originating country to most all recipient countries. The total monetary expansion globally has then become some large multiplier of the original monetary expansion of the initiating country.

If one wanted to consider the Fed’s Quantitative ease to be the first mover, the Fed’s asset accumulation over the decade was $3.5 trillion or 430% from its 2007 base. This is wildly larger than its usual annual increase which was near 4% per annum or perhaps, at most, 50% over a decade.

From that base, the other major central banks expanded in large proportions as compared to normal times so that the total asset accumulation by the major central banks, including the Fed, over the decade was plus $12 trillion or 3.4 times the Fed accumulation alone. If one were to also include the Emerging Market central banks, asset purchases would be even greater and in some instances result in the direct purchase of corporate stock including US shares by other central banks.

This is an obvious change in the landscape of what drives financial asset purchases and higher prices. It has become central bank driven and asset prices are largely independent of the strength of the economy and corporate earnings. It is arguable that stock prices and the economic fortunes had become inversely related: A weak economy caused central banks to drive up asset prices.

A further cause of the Great Disconnect of financial prices from the underlying performance of the economy and corporate earnings has been the financial dynamic of globalism. The US has run a current account deficit since goods markets became open starting in the l980s. This has put a dent into US annual GDP growth as noted above.

Ironically, the US current account deficit has an important flip side. The winners of the trade war are typically Asian and some European countries who tend to save considerably more than they are investing domestically. This leaves them with very large annual US dollar earnings allowing them to use their excess savings to acquire assets in capital markets.

The order of magnitude of this excess savings looking for a home in financial markets is presently running at $1.25 trillion per year and eclipses total US savings of about $700 billion per year. That normally is the pool of domestically generated annual purchasing power for US assets.

So the winners of the trade game are purchasing US assets with the trade spoils, contributing enormously to the Great Disconnect.

Now, financial prices have detached from ordinary standards of how much a private party will pay for a stream of earnings with a given discount rate. More fallout includes raised financial P/E ratios, lowered fixed income and real asset yields from familiar benchmark and financial markets on edge when market prices do not feel normal given the economic circumstances.

Adding to the concern, the Fed has recently announced it will unwind its extraordinary monetary accommodation. If foreign central banks also contract then that would be a legitimate concern. I am doubtful that will all occur. If the Fed is successful in raising interest rates, this will attract foreign capital, run up the dollar and do further damage to the US chronic trade deficit and slow the economy even more than it would just from the higher interest rates alone.

We are more likely heading for a long term adjustment to this excess money printing and asset buying, not by selling the assets from the central bank vaults, but by allowing the economy to grow into the higher currency level. I predict the time frame for that is more likely to be a decade of adjustment ahead. Stay tuned to TheSpellmanReport.com to see how this all rolls out. The videos of this series can be found HERE.

A Three-Part Faculty Speaker Series with Professor Lew Spellman — UT

Speaker Series, UT, Lew Spellman

REMINDER — A Three Evening Series on the Great Disconnect Of Financial Markets and the Economy Begins This Tuesday Evening

These days, I’m frequently asked to reconcile the current state of affairs in which financial markets are exuberantly priced though the economy is unable to reach its accustomed long-term growth rate. There are clear reasons why this is happening, but where does it leave investors today? On Tuesday evenings starting September 12th, I will discuss those issues at the AT&T Executive Education and Conference Center on the UT campus on the following dates from 7:30 pm to 9 pm in Room 203.

  • The Causes and Extent of the Stumbling Economy: Tuesday, September 12
  • What’s Behind Financial Market Exuberance: Tuesday, September 19
  • Investing in an Unusual Environment of Expensive Assets: Tuesday, September 26

These events are open to the public, but seating is limited. You may attend the entire series or a specific date. We need to keep a head count so reservations are requested.

RESERVE TODAY

Debt and the Sully Economy

Spellman Report, Sully, Economy

The movie Sully depicted the real life saga of an airliner taking off from New York’s LaGuardia airport. As the plane climbed on take-off, it collided with a flock of birds that disabled its engines.

With no thrust remaining, the airplane’s growth trajectory became slower and lower leaving the pilots in search of a soft landing. Today, we similarly watch government economic policymakers attempting to provide speed and lift to an economy that only seems to lose thrust which is accounted for by the same policymakers as the result of not hitting birds, but mysterious “headwinds.”

So how did it happen that after more than a century of economic growth in the 3% range that US growth has become slower and lower? Since the great housing unwind of 2008, the economy’s growth rate has been struggling and bouncing along at below a 2% growth rate — a condition being referred to euphemistically as the “new normal.”

In grappling with causes of diminishing economic growth, consideration is being given to the economy’s two sides, demand and supply. In this case, both are running at diminished rates of growth. But in terms of causation one must ask which is more responsible for the depressed growth rates of the New Normal?

About 80 years ago, in the middle of the Great Depression, Keynes considered that very same question regarding the absence of growth: was it due to a lack of demand or supply.

He concluded that the weight of the causation was with the demand side (which was at odds with the prevailing logic of those days which considered supply to be the constraining factor). He reasoned that a lack of spending thrust would in turn fail to motivate businesses to expand their supply capacity. That is, businesses would not build plant with newer high-tech machinery, spend on R & D, hire and train labor, nor produce what was expected to become unsold inventory.

So the focus became how to stimulate demand and the supply side would take care of itself. As a remedy, Keynes went on to suggest that spending financed by government borrowing could provide demand that, in turn, could lift the growth rate. Furthermore central bank low interest rates policies could also be used to encourage private parties to borrow and spend. Thus today’s use of fiscal and monetary policy was invented.

But the part he never addressed was the implications of the debt build up that occurs if fiscal and monetary policy were long used as the Rx for an economy — and we are now feeling the long term implication of that Rx. It occurs because, in future years, previous debt financed spending must be “serviced” which has implications for the future performance of the economy and we’re now living that future.

Debt financed spending requires interest and principle to be paid to the owners of said debt in future years hence reducing net income left to be spent in future years. In effect, past financed spending creates what I will call a “debt tax” as it diminishes future net income after that tax is paid. And less net income means less future demand and slower growth.

So one then must wonder what policy makers are thinking when expansionary fiscal and monetary policy is being applied, because the debt accumulation ultimately turns off an economy’s spending. It’s likely that Keynesian remedies of “expansionary” fiscal and monetary policy were justified as being counter-cyclical. That is, in the beginning they were thought to be policies to combat a recession with a corresponding obligation in the following inflationary boom to retire previously incurred debt out of boom-time revenues.

But somewhere along the way in the desperation of the new normal, policymakers began promoting expansionary fiscal and monetary policy not just to cure a recession but as an ongoing way to get back to the good ol’ 3% growth rate. This implies endlessly piling on debt and future “debt taxes” followed by depressed spending levels which in turn stimulates more corrective efforts.

For the private sector, the build-up of debt coaxed by prior depressed interest rates has constrained future spending. Indeed, in the economic expansion since the housing bust of 2008, the consumer sector has not just paid interest but retired debt perhaps not in total but as a percentage of income and this debt deleveraging has slowed the recovery from that housing bust.

The corporate sector is also capable of debt de-leveraging which it did in the aftermath of the tech boom and will need to do so again as a result of QE induced corporate debt build up.

But governments’ proclivity to deleverage debt is another story! As long as central banks and financial markets continue to finance governments’ debt habits without penalty interest rates, the government borrower incurs no market discipline and keeps on borrowing.

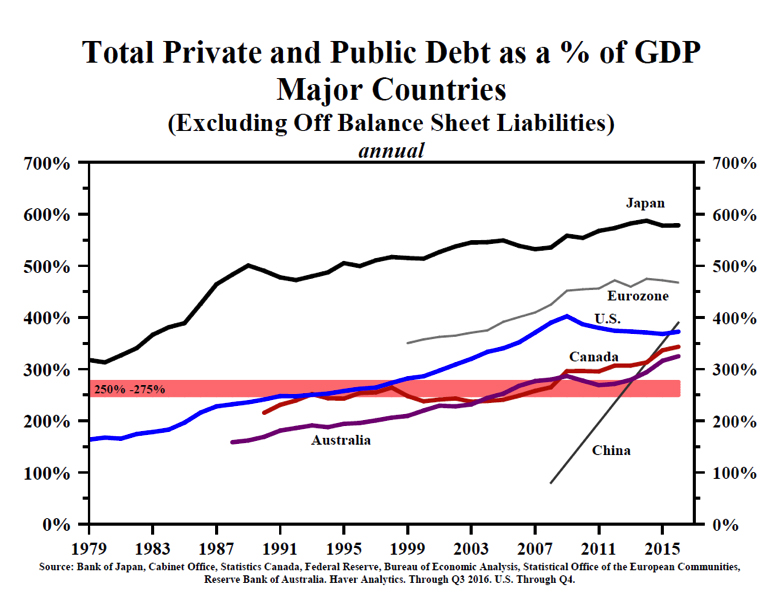
The extent of the country debt problem as it impacts future spending and growth is the sum of the debt of both the private and the public sectors relative to GDP or income. In the figure below graciously provided by Lacy Hunt of Hoisington Investment Management, are shown total private and public debt to GDP ratios for the developed countries and China. All are on the rise with China’s debt load going off like a rocket.

Since the interest bill is roughly proportionate to the debt base, the climbing ratios of debt to income implies a climbing ratio of interest expense to future income. These payments are in effect a “debt tax” levied against income across the globe. That is, the interest expense requires a larger set aside of future income even without retiring principal. For government to service growing interest expense as a proportion of income they require higher tax rates as a proportion of income which is not exactly a growth stimulant.

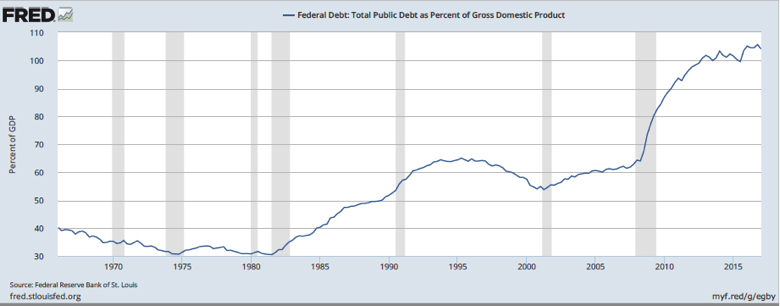
For the US government during and since the Great Recession, its borrowing grew considerably faster than income and its debt to income ratio rose as shown below causing a relative growth of interest expense to its tax base even without retiring debt.

The below figure provided by the Peterson Foundation allows one to judge the interest expense needed to be covered by the US government as a percent of GDP which is shown on the left axis.

The graph reveals that total Federal spending exceeds revenues (no surprise here). Furthermore, the difference between total spending and revenues that requires more borrowing is due to both current spending in excess of revenues shown as the whites stripe and federal government interest expense shown as the pink stripe into future years.

Hence, as a result of a growing debt ratio, the US is forced to borrow in growing proportions of GDP (or income) in order to pay interest which in turn sucks a growing proportion of future income into the “debt tax” trap and slows the economy’s future spending and growth capability. And debt overhang and slow growth is not just a US problem. Slow growth is mutually reinforcing in an open global economy.

So it should be clear that fiscal and for that matter, monetary policies such as central bank quantitative ease are not meant to be long term growth stimulants but only be used as cyclical modifiers, with a price to be paid later.

The Second Coming of the Conundrum

So You Think the Federal Reserve Controls Interest Rates? The Second Coming of the Conundrum, Lewis Spellman, The Spellman Report

So You Think the Federal Reserve Controls Interest Rates?

The Second Coming of the Conundrum

The mention of globalism causes most people to think of open trade, but globalism has another dimension to it. And that is financial globalism. It can’t be overlooked as it likely has a greater influence on financial markets than the Federal Reserve. Furthermore, it contributes to why the Federal Reserve does not seem to be able to control the long term interest rate, a condition known as the Conundrum. It’s back again.

But first, a little background.

Prior to the World Trade Organization (WTO) coming on the scene in the 1990s, most countries wouldn’t allow their financial resources to flow outward to another country. The thinking was that if their own citizens had saved, governments should restrict those scarce savings to finance production within their own borders. That is to say, if an automobile plant were to be built, governments wanted it be built on their own shores and not in Detroit, as in pre-globalism days. Furthermore, government thinking was that if domestic savings was not channeled to financing home-shore production, it could be directed to purchase home country government bonds that could cover their own fiscal deficits.

Hence, capital outflow barriers were built. Capital had a hard time leaving most countries around the globe, including most developed countries of Europe. The few exceptions were those countries that allowed free entry and exist of capital, both foreign and domestic (a pre-requisite for becoming a reserve currency country, by the way). And when foreign capital was free to both enter and leave, financial sectors emerged that offered deep and diverse investment menus to foreign investors, including the US.

That all changed when the world focused on the mutual benefits that could be derived from open trade, or what we identify today as “globalism.” Globalism was not just about lowering barriers to trade but also reducing barriers to capital flows. What unfolded was a variety of pacts, most prominently the WTO, by which member countries became committed to opening capital outflows — and capital did indeed flow out. This, then, affects the demand and pricing for securities wherever the capital chooses to land.

Higher US securities prices and lower bond yields were the first signs that foreign capital was creating greater demand, as explained in a 2005 analysis by Ben Bernanke, then a Federal Reserve Governor.

What caught Bernanke’s attention was the fact that long-maturity US bonds were appreciating as market yields trended lower at a time when the Fed was attempting to raise interest rates. The Fed was successfully raising short-maturity yields by selling short-dated bonds, but long- maturity bonds yields mysteriously moved downward.

This condition is called a yield curve flattening or inversion, depending how far it goes. For a closed economy, this is typically the result of investors choosing long-maturity bonds when they believe a disinflationary recession is in the offing, and they want to lock in the long-dated yield while it is still available. But this occurred in 2005 while the economy was “performing well” and inflation was “anchored” — in Bernanke’s words — so any thought of an impending US recession and disinflation was fleeting because the economy was entering the housing boom era. Hence, the recessionary explanation of why domestic investors would move into longer maturity debt and drive yields downward did not hold.

In sorting things out, Bernanke turned to the changes in the interest rate environment under globalism. He pointed out that some countries, especially in Asia, benefited from running a large trade surplus. This indicates that a nation earns more foreign currency than it spends in that foreign country. It accumulates a balance of the trading partner’s currency. It is also called a saving surplus, if it is greater than what it spent on domestic investment in plant and equipment. This residual provides a financial surplus that will be invested in financial markets. And with the opening of foreign markets, much of that financial investment gravitated to the US and took the form of long-term bond holdings which drove long maturity yields downward.


This raises the fundamental question of whether the Fed, despite all its pretense of managing and manipulating interest rates, can really do so in the face of open global trade in which foreign countries are running the trade surpluses and open global capital markets allowing the winners in trade to invest it’s surpluses in the US markets.

Shortly after Bernanke’s saving glut explanation of falling long-term interest rates, the then-Fed Chairman Greenspan, testifying before Congress, was asked to explain why the yield curve was inverting (meaning that as the Fed raised short-term rates, long-term rates were falling). His answer in Greenspanese was, “It’s a Conundrum.”

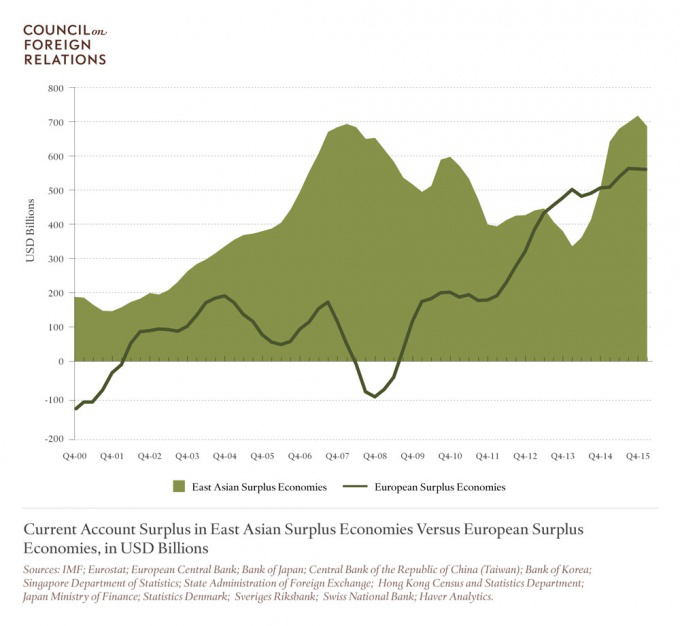
Well, the Conundrum is back today in 2017. The Fed is again seeking to raise rates. It’s been successful with short-term rates by selling short-term instruments, but the long-term rates have been falling since the beginning of the year. What’s also back is another large upswing in global savings in USD, as shown below in data supplied by Brad Setser of the Council on Foreign Relations.

Current Account Surplus in East Asian Surplus Economies Versus European Surplus Economies, in USD Billions

Setser summarizes:

“The combined savings of China, Japan, Korea, Taiwan, and the two city-states of Hong Kong and Singapore is about 40 percent of their collective GDP, a 35-year high. No other region of the world currently contributes more to the global glut in savings that has brought interest rates around the world down to record lows. Asia’s current account surplus — its excess of savings over investment — has increased significantly in the past two years and is now about as large, relative to the GDP of its trading partners, as it was prior to the global financial crisis.”

Note that on the graph the excess savings over investment data is measured in billions of US dollars for both the East Asian and European (Saving) Surplus Economies. Now compare that to the Fed’s selling in their effort to raise rates. It has sold approximately $200 billion of short-term Reverse Repo debt, whereas the surplus savings of East Asia and Europe (depicted above) total approximately $1.2 trillion at an annual rate which is looking for a home in global financial markets. Not much of it has to trickle into the US bond market to offset the Fed’s selling.

So there you have it. If what is lost in trade trickles back into the financial markets, the Fed has lost its power to control market prices and interest rates as they wish. The power to offset the Fed exists and so the US central bank does not control interest rates in the US as it once did in a non-globalism world. And if it can’t, it’s lost its controlling influence over the US economy.

SaveSave

SaveSave

SaveSave

Bridge Over Troubled Waters: The Plunge Protection Team at Work?

6.2.17spellmanreport, Bridge Over Troubled Waters: The Plunge Protection Team at Work?

There have been many recent references to US stock prices relative to earnings (P/Es) being uncomfortably high. Not in absolute terms, mind you, but relative to historic norms considering the lagging growth rate of the economy and earnings. This inconsistency is being taken as evidence, by some, that there is another “conspiracy” underway — this time by the government’s Plunge Protection Team to raise and then support those higher stock prices.

Well there is a mechanism by which the government’s Plunge Protection Team can support stock prices (see below), but today’s market action doesn’t meet the plunging prices criteria for their involvement. Actually, we have exactly the opposite: upward price drift with relatively low volatility.

This doesn’t mean there isn’t central bank support of stock prices and other risk assets — there is, and it’s epic. But this post is about why and how this support of asset prices, including risk assets, is occurring.

First off, it shouldn’t be news to anyone that we have a worldwide economic system that is plagued with very high debt levels. The concern is not in the absolute level of debt so much as in the debt relative to the income resources needed just to cover the interest. The global debt problem includes not just the developed countries (the US, Europe, and Japan) but also China, as well as most emerging nations.

This growth of debt relative to income creates troubled waters for which a bridge is needed to safely navigate the obstacles.

First, the existence of the debt pressures the debtors of the world, both public and private, to reduce spending so as not to add to their debt overload. This has an adverse effect on the demand side of an economy, emanating from either the public or private sectors or both. For example, we can see the pressures mounting as Congress comes to grips with the size of the Federal deficit, which is acting as a constraint on more spending, which in turn leads to less demand for goods.

Spending less in order to stop adding to debt works for individuals. But if a country were to spend less — let’s say by the government or the consumers in aggregate — it also reduces country income. That is, frugality or austerity (depending on how one views it) can work for the individual because it doesn’t really reduce one’s income.

But for a country it does, and this is the debt trap we are in now. These are the troubled waters of compromised economic growth.

The second problem arising out of excess debt is vulnerability to another financial crisis like the one from 2008. Generally speaking, when there are extreme quantities of anything, an over-supply means downward pressures on the market price of the over-supplied item. And that includes government and private debt.

So this puts into motion a process by which those who purchased and hold the debt become vulnerable to a deterioration in market value. To those owners of the debt, whoever they may be (banks, pension funds, etc.), the market debt instruments are their assets, and if there is too much of it, per se, there are downward pressures on the value of institutional assets.

For the institutions owning these assets, this is a major problem. It can cause the financiers of those institutions (depositors or repo lenders, for example) to give pause and not automatically roll over their funding to these institutions owning the vulnerable debt. Thus, even without a concern for asset quality, the over-supplied debt sitting on the institutions’ balance sheets is a red flag. (Think what happened to the institutions last time around in 2008 when they held oversupplied mortgages.)

As a result, those who fund the institutions’ asset purchases naturally become concerned and start to demure from requests by the institutions to roll over their funding for longer periods of time.

This over-indebtedness creates the fear of declining asset values, and it becomes self-actualizing even if there’s not an actual default on those assets. The trigger is when the nervous funders seek to cash out their funding and, hence, force the institutions to sell the over-supplied assets in order to be able to pay the funders who want out. And selling those assets depresses their price while the line to cash-out gets longer and longer.

The institutions in question include banks of all varieties: commercial, investment, and shadow. It also includes money market mutuals and all asset-backed securities that, by definition, hold the over-supplied debt whether it be government debt, student loans, auto loans, or corporate junk debt.

If you believe this is a matter for only to those in high finance and that you are not subject to this risk, think again. This is the description of a deposit run on commercial banks, savings banks, and credit unions in which the “man on the street” is the funder (otherwise known as a depositor), and that includes you and me.

The policy solution to this problem that visited us worldwide not 10 years ago was to keep asset values afloat, especially when a government has written a blank check to cover the losses to depositors (called deposit insurance) or other Federal asset guarantees such as on mortgage-backed securities or student loans.

So this is a motivation on the part of policymakers not to allow the over-supplied institutional asset values to decline a la the financial crisis of 2008 — particularly if the government has guaranteed the funding. In that case, the short fall becomes a government and taxpayer liability, otherwise known as deposit insurance or other government third party guarantees.

Central banks are the first, second, and third lines of defense against a financial meltdown, but now they have an incentive to foster an asset inflation lest one of its protected banks experiences a deposit run, which would create uncertainty for all banks.

Of course, this motivation for asset support is not expressed, because if the Fed’s concern for asset prices is reflected in a public statement, it triggers the very event they are attempting to prevent. Therefore, a cover-up is in order.

So, in a way, it’s a conspiracy.

As a result, the Fed’s rationale for being in financial asset support mode is couched in terms of helping the unemployed when the central banks of the globe buy, buy, and buy to create the demand equal to the bloated outstanding supply of debt — and in so doing provides support for their prices.

The chart below shows the assets of the major central banks over the last decade (and does not include China and the Emerging Market Countries). The major central banks’ balance sheets have been the ongoing solution to maintaining market values of debt, as their debt purchases have risen by $12 trillion from a base of $6 trillion in 2008. This compares to an issuance of US government debt over the same time period of approximately $10 trillion. So in round numbers, the added demand ($12 trillion) just from major central banks offsets the added supply ($10 trillion) of US government debt.

Now getting back to the “conspiracy” of how that affects equity pricing and things as the market P/E: It must be understood that central banks tend to purchase government debt but that “official” buying of “official” assets bleeds into market support for ALL assets, including risk assets such as stocks, real estate, etc.

The indirect market support for risk assets is a twostep processes. In the first step, central banks purchase “official” assets (government bonds) from private sellers (not the government).

In the second step, the private sellers of the government bonds now has the cash and is looking for a replacement asset that, for whatever reason, they deem to be more desirable than holding the “official” asset that it just sold to the central bank. So the new, at-the-margin financial buying power spreads out and elevates the price of risk assets across the board, including in foreign markets if the acquisition of assets wanders there.

All this is a long way of saying that under the cover story of providing jobs for the unemployed, the Federal Reserve and most other central banks around the globe are creating higher asset prices and providing private sellers of official assets with the cash in-hand to purchase risk assets and, therefore, are generating an elevated P/E ratio for stocks.

The same can be said for the market valuation of real estate. That is to say, risk assets are substitutes for official assets. Indeed, the private portfolio managers sell off official assets to the central banks because they think they found a “bigger fool” who will pay more for them.

But that’s not the end of the “official” buying of “official” assets because when some private managers direct some of their replacement buying to foreign financial markets as indicated above. This elevates risk asset prices abroad as well. It also drives foreign currency prices upward relative to the US dollar because the buying moves through the foreign exchange market to reach the foreign asset.

In turn, typically, the emerging market’s central banks then intervene in the currency market to lower its exchange rate to the US dollar to where it had been prior to the foreign financial inflow to its market. This re-setting of its currency allows them to continue enjoying a trade surplus against the developed countries.

This link to the foreign central bank reaction is sometimes called “The Currency War.” Their purchases of US dollars in the foreign exchange market, paid for with their own currency, resets export competitiveness. The US dollars purchased in this transaction are noted on their balance sheets as foreign exchange reserves, but there is no reason to hold US dollars that do not earn income. So it has become the standard for foreign central banks to turn around and purchase interest-bearing US dollar debt with newly purchased dollars. Some even purchase US risk assets with the dollar proceeds, including corporate stock.

This additional market support from emerging market official buying amounted to another $6 trillion over the same time period considered above. In essence, there is a “money supply multiplier” in that the developed countries’ monetary expansion causes export-reliant countries to also expand their central bank money and purchase US assets. So the developed world central banks expanded by $12 trillion, and the EM central banks expanded their US assets by an additional $6 trillion.

The bottom line is that excess country debt has become targeted by central banks because they have a vested interest not to allow their bond prices to decline in market value. This, in turn, supports risk asset prices because risk assets are substitutes among investors. These risk asset purchases create higher equity prices and relatively stable P/E ratios irrespective of the changing fortunes of the underlying corporate earnings and the growth of those earnings. When a company’s earnings disappoint, central banks do not panic and sell, sell, sell. If anything, they are motivated to disallow a price correction and intensify their buying.

In essence, central banks have been building bridges over the troubled waters of excess debt, slow economic growth, and the vulnerability to asset price meltdown.

Thus, those US stock market mavens have good reason to be wondering what in the world has happened to their understanding of market P/Es. They are no longer consistent with what one would historically expect from a slow growing economy.

It’s indeed difficult to relax as an investor when you know you’re crossing troubled waters. The government has built bridges for us to cross, but those bridges are producing high P/Es that are out of line with the underlying fundamentals as we used to know them.

Hence, an excess debt environment creates pressures for austerity and low growth and puts the central banks in the unseemly position of indirectly supporting all asset prices and using a smoke screen to do it (we are here to save the unemployed). So as the mavens suggest, there is a mechanism at work to support risk asset prices, but it’s not the Plunge Protection Team… though they will likely be called in if the bridge doesn’t hold.


*The Plunge Protection team is the name given by the Washington Post to the government group that first acted in l987’s flash crash. It now has authority to intervene in the stock market. There are four voting members to do so: the Federal Reserve Chairman, the Secretary of the Treasury, the Chairman of the SEC, and the Chairman of the Commodity Future Trading Commission. In order to intervene, it requires a vote of at least three members and the approval of the president. The method of doing so is typically for the Federal Reserve to lend or fund an investment bank asset purchase of stocks to be wound down at some future time when the prices have been re-established. This loan obligation is annulled to the extent that losses might occur.

Houston, We’ve Had a Problem

The Federal Reserve responded to the spectacular financial meltdown of 2008 by putting a bottom under the cascading financial prices. This was accomplished by buying, buying, and buying some more. Then when the downdraft of prices reached bottom, the Fed phased in additional largescale asset purchases with the intent of providing cash resources to banks in order to start the bank expansion and economic rebuilding process. This reduced interest rates to the most affordable of all times as a way to induce prospective borrowers to spend more money.

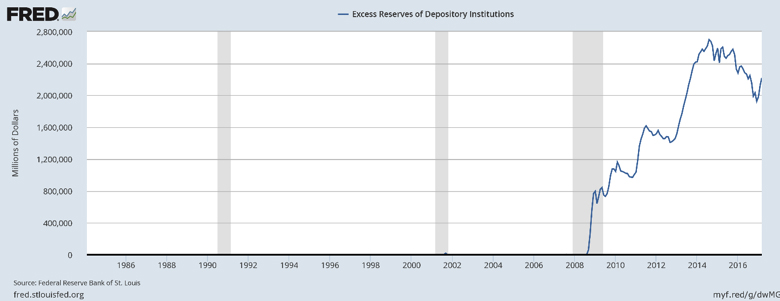
All told, the Fed buying spree increased its balance sheet assets from $ .8 to $4.3 trillion — an increase of 5.5 times. For comparison, a normal Fed buy over that time period would have increased its assets by only .36 times. When all the Fed’s buying power is deposited with banks, it results in bank cash reserves in excess of the minimum required from which the banking system can ramp up credit by some multiple.

To give you can idea of how extreme this was, the graph below shows the excess cash reserves that banks held from 1985 through 2016. This is the base upon which banks can build lending some multiple of the excess cash. Before 2008, excess reserves were essentially zero. After 2008, they went into orbit.

Nearly nine years later, there has been an economic uplift — but it has been disappointing. The economic growth rate reached approximately half the growth rate it had formerly been capable of, which appeared to reduce the unemployment rate to the 5 percent target. But this reduction was made easier as the population’s labor participation rates have been dwindling.

Even so, the Fed has claimed bragging rights for a successful economic “save,” but it still left interest rates too low to take care of its other “constituency”: Baby Boomer investors in need of a yield on (relatively) safe fixed income in order to finance their retirements, either from their savings or by way of their pension funds, insurance annuities, etc.

So for that constituency to “get theirs,” the Fed’s Normalization Plan calls for raising interest rates and cutting its own balance sheet down to size. This implied selling of Federal Reserve owned assets would sop up excessive commercial bank cash reserves. And that would prevent low interest rate bank loan expansion.

Thus, large scale selling not only sops up cash but also puts downward pressure on market determined bond prices and upward pressure on market yields, both in the open market and at the bank loan counter. It’s enough selling to absorb almost all of the remaining excess cash on bank balance sheets so that banks thereafter would be restrained from advancing credit.

This is a reversal of Fed expansion in which the Fed buys assets with new money to fuel commercial bank lending. The last three generations of macroeconomic students worldwide might recall that this went under the name “the money supply multiplier.”

So in a general sense, you can see that putting monetary policy in a serous reverse course raises the question of can a tepid economy continue its relatively slow motion advances?

Formerly, this is the sort of thing that was done in a far less aggressive form when the Fed set out to restrain an economy that was generating inflation. But today, there is no runaway inflationary dog that needs to be reined in with a tight leash, a la Paul Volcker.

What is also concerning about the tight leash is that it’s being used at a time when the new G-20 Basel liquidity requirements (meaning banks must hold more cash) are being imposed on the banks of the G-20 countries. So cash just sits on bank balance sheets and can’t be used to ramp up lending because it’s being used to fulfill those liquidity requirements.

As described in “It’s a Whole New Monetary Ballgame,” we now have duel cash regulations imposed on banks. (Just what the banks needed, more regulation!) They have both their own domestic regulatory apparatus of required cash reserves and the G-20 regulations from Basel, Switzerland.

So the removal of bank cash via “Normalization” comes at a time when the banks already need to place cash on hold to satisfy Basel’s rules. That surely suggests a constraint on bank loan growth.

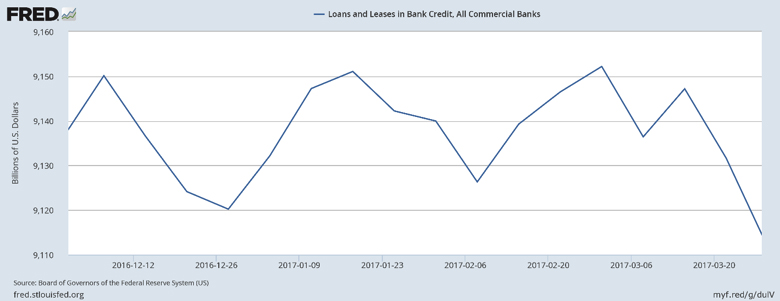
And this indeed is what has occurred over the last four months. Bank loan levels (seasonally adjusted) are shown below.

So the Basel liquidity requirements are a leading theory of why the slowdown of bank lending is occurring. At this point, though, that’s only a guess because the actual amount of cash required to satisfy Basel is based on each individual bank’s 30-day cash needs during a financial crisis as determined by an annual regulatory audit — but that’s not released to the public.

Whether or not this new cash requirement is deterring bank loan growth, it’s not consistent with maintaining economic growth, and it’s likely to cause a “Houston, We’ve Had a Problem” moment for the Fed.

If you recall, those words were transmitted from Apollo 13 to Mission Control in Houston in 1970. As the flight crew approached the moon, they heard a loud pop, and the command module of Apollo 13 subsequently began losing oxygen. This, in turn, required the crew to reverse course and attempt a death-defying return to Earth. The question is, will the Fed similarly be forced to reverse course after years of planning for normalization? Because it appears that banking lending is losing oxygen.

If so, there will be consequences for an already tarnished Federal Reserve that has fallen from esteem in the eyes of the market, Congress, and perhaps the administration. So the best laid plans to get to the moon — or, in this case, to bring central and commercial banks back to normalcy and land the economy safely with higher interest rates — has a reasonable chance of being scuttled.

So there are far more questions to this story than answers. Stay tuned to find out whether the monetary version of Apollo 13 lands “normally” with smaller balance sheets and higher interest rates while maintaining economic growth, or whether the Fed is forced into a humiliating about-face that requires it to maintain its easy money profile until the economy can be made to somehow grow on its own without monetary excess.

In order to go back to monetary and interest rate normalization, we need the economic responses that the new administration is tinkering with to unleash economic growth as we used to know it.

The Pernicious Effects of Debt Accumulation: An Interview with Lacy Hunt

This past December, ahead of the 80th anniversary of John Keynes’ General Theory, I sat down with renowned macroeconomist and investment manager Dr. Lacy Hunt to talk about debt accumulation, slowing aggregate demand (he says the two are closely linked), and the possible ways both can be overcome.

Because Keynes’ ideas of using monetary and/or fiscal policy to stimulate an economy worked through debt-financed spending, it should be no surprise that debt has risen relative to the income that services the debt.

Debt accumulation tends to become a large claim on future income, which reduces future spending. Lacy argues debt is associated with a slowing of aggregate demand, making it disinflationary in nature, which in turn depresses growth, inflation, inflation expectations, and interest rates. Presently, $2 trillion of US debt is scheduled to be refinanced in the next two years, but if it’s refinanced at a mere one percent higher rate, it would reduce economic growth by 1 percent of GDP.

This is exactly how debt slows an economy.

What’s more, diminished growth rates depress population growth and productivity because of a lack of business investment. So, the full range of effects are not just to aggregate demand but also to aggregate supply.

The debt load has transformed the economy into something we are not familiar with — a sluggish stuck economy. Furthermore, debt accumulation compromises further use of monetary and fiscal policy as the standard multipliers have been defused, if not turned negative.

Given these difficulties of generating growth in aggregate demand, President Trump’s proposals that speak to aggregate supply hold more promise than debt-financed spending.

These are the cyclical issues, but debt accumulation raises many core secular problems as well. In the larger picture, debt has accumulated to the point where it has created a self-reinforcing process of giving rise to yet more debt. Given the propensity of debt to generate more debt, Lacy and I discuss likelihood that markets could price sovereign risk rendering the debt less sustainable.

Given those possibilities, Lacy addresses the means by which government debt might be contained or dissolved, as well as the ramifications of money issuance as an alternative means to handle future unfunded federal obligations.

Additionally, debt loads are also affecting other countries. In that regard, Lacy contemplates the benefits to some EU members if they were to withdraw from the Euro.

Lacy Hunt has been called a bond guru. He’s the chief economist and executive vice president at Hoisington Investment Management in Austin, but he cut his teeth during the days of Richard Nixon and the Great Inflation. Here, he offers his frank and forthright assessments of the issues facing the US economy and all of its participants. His insights are nothing short of profound. Click the image below to watch the full interview or read the transcript that follows.

Lewis Spellman

Is your Child’s Lemonade Stand Against the Law?

In a world of Keynesian thinking, which has been in vogue for more than 60 years, moving an economy to higher output requires spending in excess of income. This is usually financed by lending to the private sector.

To accomplish this, borrowing costs are reduced to encourage (you guessed it) more borrowing and more spending on investment products that yield positive returns. But if the private sector doesn’t snap up the bait, governments can step in to be both the borrower and spender. And step in they did.

Following this script, in order to motivate that higher output when the Great Recession hit, borrowing rates were pushed down to a minimal level in the US and to a negative rate in the Euro zone. Realize what negative borrowing rates mean. We (the lender) will pay you (the borrower) to borrow. So please do so, and please spend the funds on something to create output and jobs!

It’s a tempting offer, but it didn’t have the intended effect. That is to say, corporate borrowing did occur, but the spending on physical or intellectual property did not. Instead, corporations have been stockpiling cash.

Alas, the funds have been primarily used to support corporate stock prices via dividends or stock buybacks. Another use has been corporate buyouts (M&As) in order to reduce competitive pressures on prices and profits.

The relative non-response of investment spending to the low cost of funds amounts to a Keynesian conundrum wherein lower interest rates have not been the solution to business lethargy.

Indeed, businesses’ muted response to cheap money suggests there are impediments to putting that money to work. So what’s the fly in the ointment? The experience based gut reaction of a CEO oriented administration points to regulatory barriers. And this view is buttressed by the accumulating data on the cost of regulation. For example, the Competitive Enterprise Institute puts the annual cost of regulatory barriers to $14,678 per household or 23% of the average household income.

This has made the reduction in regulation, a top agenda item for the Trump administration which has instituted a 2-for-1 rule. Each new regulation requires jettisoning two others for a net -1. But this doesn’t begin to scratch the surface of the mountain that needs to be leveled. Currently, there are 178,277 pages of Federal regulations with which American businesses, workers, and consumers must comply. The Trump administration is aiming for a 75% reduction of that amount.

Here’s some background on how we got here: Regulations started out as constraints on what economists call “externalities.” In other words, they were a way to restrain economic actions that affect external parties without consideration or compensation. But the process of creating regulations to counteract negative externalities has morphed into something else entirely. Now federal agencies are authorized to promulgate rules based on existing legislation which appear in the Federal Register in the hundreds of thousands.

We can track the number of rules but more importantly we focus not on the numbers but on the effects of those rules on business entry and growth. To that end, the Census Bureau keeps statistics on death and birth rates of enterprises in America. Not surprisingly (albeit alarmingly), the birth rate of enterprises has been falling for 40 years and has especially nosedived since 2008, as shown below.

In absolute terms, the birth of business enterprises is not just declining but has declined to a level below the death rate. This means the number of businesses in America has been on the absolute decline since 2008.

To take a very simple example as to the impact of regulation, let’s say your 7-year-old has an ambitious idea. Because you live on an access to a state park with visitors and hikers walking by, she has the idea to open a lemonade stand. Well, if you are up-to-speed on business regulations, you might start to envision the criminal and civil offenses your child might be committing, and there are innumerable candidates to choose from. There are forms, permits, and permissions and compliance costs to think about if she’d like to sell lemonade legally (so you might as well steer your child away from selling Girl Scout cookies too).

For an actual start-up, it takes thousands of hours of billable attorney’s fees to properly navigate all the relevant regulations. For most, this is unaffordable. In their case, starting a business requires an article of faith that what they’re doing is somehow not illegal.

In my mind’s eye, I have a vision of Michael Dell producing computers in his dormitory room and delivering them from the trunk of his car. From there, he went on to become an industrial giant. You have to start somewhere, but — alas — it seems innovation like his is no longer an innocent opportunity and without it, we are left in a withering state as far as enterprise is concerned.

So yes, the Trump nominees have little-to-no government experience and will blunder, but what they do have is experience in producing business results that, in turn, translate into income and jobs for a lot of other people. I will take their government on-the-job training any day as compared to those steeped in how to promulgate regulations. Indeed, these nominees have a far clearer understanding of what it takes to succeed and what barriers need to be eliminated in order to do so. Or better still, ways to achieve goals while not impeding business.

Even if that business is just a child’s lemonade stand.


For the Millennials, The Social Security Chickens have Come Home to Roost

1965 was a momentous year for the US. LBJ, the newly elected President, was in a bind. He had objectives that required spending, which would generate a fiscal deficit —and, in turn, more government debt. But coming out of WWII, fiscal deficits were considered to be taboo by both political parties because they would further add to wartime debt accumulation.

The game plan, which should again be considered today, was: Don’t add more debt. Instead, grow the economy without additional government fiscal deficits. The plan implied having a balanced federal budget, while still growing income to service the debt load. (No doubt, the subject of a future blog.)

So the challenge for LBJ was to escalate the Vietnam War effort and make good on expensive campaign promises (called the “The Great Society”) all while running a balanced fiscal budget.

The Great Society was multi-dimensional but, most important, involved entitlements on a grand scale that included the expansion of Social Security and the introduction of Disability and Medicare.

So what came of it was perhaps the beginning of the government ethic to vote for whatever America wanted and to find a way, however devious, to finance it.

A way was found, and it’s still used today. The Federal Government would raid any pot of taxpayer money set aside for another purpose and spend it — and then cover it up.

How it is done is most easily understood with an analogy: A family is attempting to provide a college fund for its children. The children work while in high school and contribute to the college fund cookie jar each week. So do mom and dad. Except dad, exercising his sovereign oblige, dips into the cookie jar regularly to pay for whatever seems more pressing at the time. In return, he leaves a note — an IOU — to be due when funds are needed for their stated purpose.

Dad’s IOU does not appear on his balance sheet, but when college expenses need to be covered, he goes to his friendly bank for a loan to make good on the funds he raided. The loan from the bank provides the funds to retire his IOU but the bank loan goes on dad’s balance sheet. It’s a market transaction and adversely affects dad’s credit rating and the cost of borrowed funds from outside the family.

This is the general mechanics of what has occurred on a grand scale with the social insurance trust funds. The particular pot of money most tempting for the government to raid for other use was the Social Security “trust” fund. That’s because it was large and growing, at the time, as the Baby Boomers were just entering the labor force hence contributing to the Social Security trust funds via the payroll tax.

What made Social Security funds even more a target was that the great majority of the beneficiaries wouldn’t be scheduled to receive promised benefits for decades. That is, the missing funds not be missed for some time.

In order to raid the trust funds and cover it up gracefully, the government used an accounting sleight of hand. The Federal budget (in deficit) was consolidated with the Social Security budget (in surplus). This gained access to the unspent social security trust inflows to be spent on non-Social Security items. Furthermore with deficits and surpluses offsetting, the consolidated budget was near balanced affording the politicians the ability to claim fiscal responsibility to boot.

Hence with the surging Baby Boomer contributions of young workers exceeding the payouts to those retiring, the good ol’ government would spend the bonanza on the pressing wishes of the day. As the Treasury confesses (page 6):

“When revenues in the trust exceed benefit payments, the unspent monies must remain in the trust fund for future use. However, this excess cash is transferred to the Treasury’s General Fund and is used to finance other activities which fall outside the specific purpose of the trust fund.”

To give you an idea of the intent to cover-up the transaction, when Social Security cash was used by the Treasury for general purposes, the IOU placed in the fund was a new category of government debt created for the purpose of the cover-up. It is called “special debt,” not to be confused with “market debt,” a distinction the Treasury maintains.

The reason is special debt isn’t reported on the federal balance sheet and, in today’s financial nomenclature, is referred to as “off-balance sheet” debt. In other words, hidden debt.

The special debt is basically an IOU just like dad’s which is not sold on the market. Nor is it accounted for on the government balance sheet. This means the special debt issuance does not affect the market pricing of debt, nor the tally of debt on the government’s books and it is effectively below the radar when it comes to the market appraisal of the riskiness of the government debt load.

The raiding of social security trust funds and its cover up has worked smoothly behind the political and accounting scenes for a half century. But alas, with the arrival of the Baby Boomers at the trust fund window to claim benefits, at least one category of trust funds, the Disability Insurance fund is now running negative cash flow.

Like dad, the government needs to make good on the cash-call to pay the benefits and has begun to borrow the funds with on-balance sheet US Treasury debt. At this point in time, the chickens have finally come home to roost.

These days, the annual increase in government market debt now covers not just current fiscal deficits of the government but also covers the cash call for the special debt. For example, in the most recent fiscal year, the government fiscal deficit was $575 billion, but US Treasury debt sales were $1.3 trillion (which is not a trifiling matter.)

Hence, we have entered the era when government debt accumulation is greater than the already-large ongoing federal deficit. Ultimately, it will adversely affect the market’s perception of the riskiness of US government debt as it piles up.

All this might seem like a fairytale gone badly but unfortunately it’s not a fairytale. But realize, it could have been avoided and can still be avoided for the millennial generation. It’s not too late for them to actually have a funded pot, with money that could grow for decades while invested in the private sector, when it’s their time to claim Social Security.

Such is the state of Social Security in countries that actually invested the funds in the private economy. Chile was the pioneer and was more or less followed in Latin America. It’s called “privatization” of Social Security. The trust funds have basically been invested in private sector funds that included private sector debt, a stock market index fund, and a foreign stock index fund, in addition to a government bond fund.

These funds, decades later, are paying out two to three times more than the payouts originally scheduled through investing in government bonds. If the private funds do not outperform the scheduled Social Security payout, the government would make up the difference — but that has never been necessary.

If funds contributed in, say, in 1970 had been invested in an S&P index fund, they would be redeemed today at about an 8 to 1 ratio as compared to the contribution at that time.

Providing for Social Security in this manner has other important benefits as well. Social Security contributions would be financing business sector expansion as opposed to government spending.

Moreover, workers would have a stake in the growth of corporate stock valuations and this would serve to reduce the contentious economic and political divide that exists in the US.

As it stands, the millennials social insurance contributions will fund the retirement of their parents’ generation and when their funding is insufficient they will have to support via higher taxes, a higher government debt load over their lifetime.

You millennials, it’s time to make your voices heard. Pass it on.


Post navigation

← Older posts

Receive The Spellman Report Monthly for Bracing Economic and Financial Insight


Click to Subscribe Now
Click to Email Dr. Spellman
Tweets by spellmanreport
Lew Spellman

Lew Spellman is Professor of Finance at the University of Texas McCombs School of Business. The Spellman Report seeks to interpret current and future trends in the economy and financial markets from the perspective of history, theory and policy.

Other Commentary

Frank Beck, Beck Capital Management
Bill Gross, Janus
The Grumpy Economist
Jeffrey Snider, Real Clear Markets
Ben Bernanke
Hoisington Management, Economic Overview

RECENT POSTS

  • Déjà Vu All Over Again: Today’s Suspicious Looking Stock Market
  • A Summary of the Great Disconnect Series
  • A Three-Part Faculty Speaker Series with Professor Lew Spellman — UT
  • Debt and the Sully Economy
  • The Second Coming of the Conundrum
  • Bridge Over Troubled Waters: The Plunge Protection Team at Work?
  • Houston, We’ve Had a Problem
  • The Pernicious Effects of Debt Accumulation: An Interview with Lacy Hunt
  • Is your Child’s Lemonade Stand Against the Law?
  • For the Millennials, The Social Security Chickens have Come Home to Roost

POSTS BY TOPIC

Disclaimer: The Spellman Report is not an offering for any investment. It represents only the conclusions and analysis of Professor Lewis Spellman. Any views expressed are provided for information purposes only and should not be construed in any way as an offer, an endorsement, or inducement to invest.
© 2016 The Spellman Report
↑