
Debt and the Sully Economy


The movie Sully depicted the real life saga of an airliner taking off from New York’s LaGuardia airport. As the plane climbed on take-off, it collided with a flock of birds that disabled its engines.
With no thrust remaining, the airplane’s growth trajectory became slower and lower leaving the pilots in search of a soft landing. Today, we similarly watch government economic policymakers attempting to provide speed and lift to an economy that only seems to lose thrust which is accounted for by the same policymakers as the result of not hitting birds, but mysterious “headwinds.”
So how did it happen that after more than a century of economic growth in the 3% range that US growth has become slower and lower? Since the great housing unwind of 2008, the economy’s growth rate has been struggling and bouncing along at below a 2% growth rate — a condition being referred to euphemistically as the “new normal.”
In grappling with causes of diminishing economic growth, consideration is being given to the economy’s two sides, demand and supply. In this case, both are running at diminished rates of growth. But in terms of causation one must ask which is more responsible for the depressed growth rates of the New Normal?
About 80 years ago, in the middle of the Great Depression, Keynes considered that very same question regarding the absence of growth: was it due to a lack of demand or supply.
He concluded that the weight of the causation was with the demand side (which was at odds with the prevailing logic of those days which considered supply to be the constraining factor). He reasoned that a lack of spending thrust would in turn fail to motivate businesses to expand their supply capacity. That is, businesses would not build plant with newer high-tech machinery, spend on R & D, hire and train labor, nor produce what was expected to become unsold inventory.
So the focus became how to stimulate demand and the supply side would take care of itself. As a remedy, Keynes went on to suggest that spending financed by government borrowing could provide demand that, in turn, could lift the growth rate. Furthermore central bank low interest rates policies could also be used to encourage private parties to borrow and spend. Thus today’s use of fiscal and monetary policy was invented.
But the part he never addressed was the implications of the debt build up that occurs if fiscal and monetary policy were long used as the Rx for an economy — and we are now feeling the long term implication of that Rx. It occurs because, in future years, previous debt financed spending must be “serviced” which has implications for the future performance of the economy and we’re now living that future.
Debt financed spending requires interest and principle to be paid to the owners of said debt in future years hence reducing net income left to be spent in future years. In effect, past financed spending creates what I will call a “debt tax” as it diminishes future net income after that tax is paid. And less net income means less future demand and slower growth.
So one then must wonder what policy makers are thinking when expansionary fiscal and monetary policy is being applied, because the debt accumulation ultimately turns off an economy’s spending. It’s likely that Keynesian remedies of “expansionary” fiscal and monetary policy were justified as being counter-cyclical. That is, in the beginning they were thought to be policies to combat a recession with a corresponding obligation in the following inflationary boom to retire previously incurred debt out of boom-time revenues.
But somewhere along the way in the desperation of the new normal, policymakers began promoting expansionary fiscal and monetary policy not just to cure a recession but as an ongoing way to get back to the good ol’ 3% growth rate. This implies endlessly piling on debt and future “debt taxes” followed by depressed spending levels which in turn stimulates more corrective efforts.
For the private sector, the build-up of debt coaxed by prior depressed interest rates has constrained future spending. Indeed, in the economic expansion since the housing bust of 2008, the consumer sector has not just paid interest but retired debt perhaps not in total but as a percentage of income and this debt deleveraging has slowed the recovery from that housing bust.
The corporate sector is also capable of debt de-leveraging which it did in the aftermath of the tech boom and will need to do so again as a result of QE induced corporate debt build up.
But governments’ proclivity to deleverage debt is another story! As long as central banks and financial markets continue to finance governments’ debt habits without penalty interest rates, the government borrower incurs no market discipline and keeps on borrowing.
The extent of the country debt problem as it impacts future spending and growth is the sum of the debt of both the private and the public sectors relative to GDP or income. In the figure below graciously provided by Lacy Hunt of Hoisington Investment Management, are shown total private and public debt to GDP ratios for the developed countries and China. All are on the rise with China’s debt load going off like a rocket.
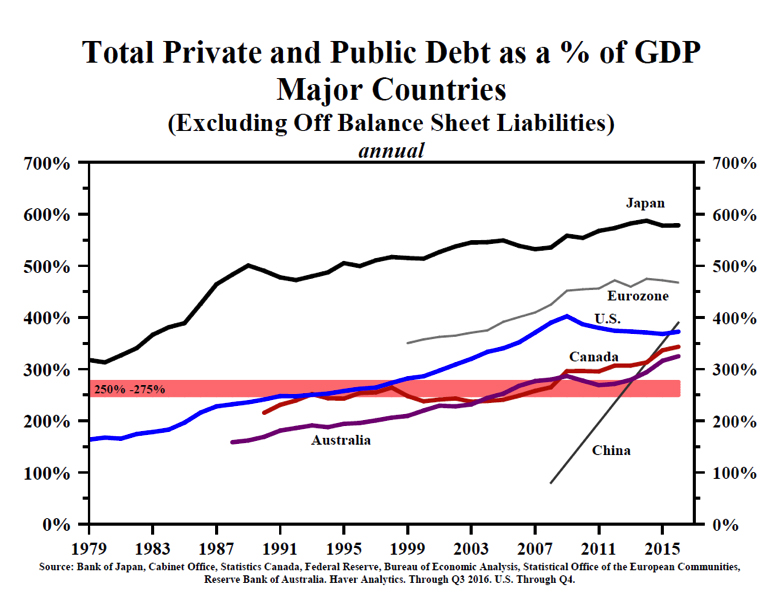
Since the interest bill is roughly proportionate to the debt base, the climbing ratios of debt to income implies a climbing ratio of interest expense to future income. These payments are in effect a “debt tax” levied against income across the globe. That is, the interest expense requires a larger set aside of future income even without retiring principal. For government to service growing interest expense as a proportion of income they require higher tax rates as a proportion of income which is not exactly a growth stimulant.
For the US government during and since the Great Recession, its borrowing grew considerably faster than income and its debt to income ratio rose as shown below causing a relative growth of interest expense to its tax base even without retiring debt.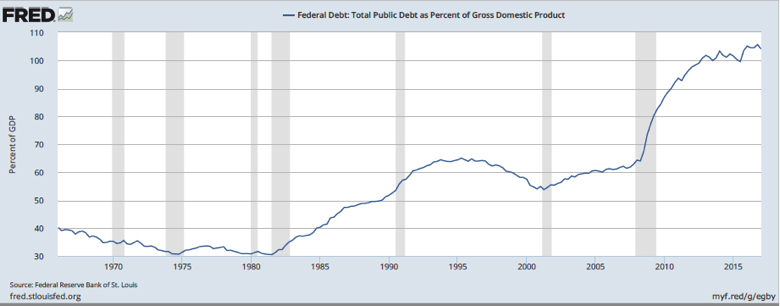
The below figure provided by the Peterson Foundation allows one to judge the interest expense needed to be covered by the US government as a percent of GDP which is shown on the left axis.
The graph reveals that total Federal spending exceeds revenues (no surprise here). Furthermore, the difference between total spending and revenues that requires more borrowing is due to both current spending in excess of revenues shown as the whites stripe and federal government interest expense shown as the pink stripe into future years.
Hence, as a result of a growing debt ratio, the US is forced to borrow in growing proportions of GDP (or income) in order to pay interest which in turn sucks a growing proportion of future income into the “debt tax” trap and slows the economy’s future spending and growth capability. And debt overhang and slow growth is not just a US problem. Slow growth is mutually reinforcing in an open global economy.
So it should be clear that fiscal and for that matter, monetary policies such as central bank quantitative ease are not meant to be long term growth stimulants but only be used as cyclical modifiers, with a price to be paid later.