
The Recovery from the Great Recession is over. What Happens Next?


It’s time for a new perspective. The Great Recession that began in 2008 was deep and long, and the recovery that began in 2009 has now finally concluded. The large gap between what is being demanded, measured in terms of GDP spending, has now caught up with the economy’s ability to produce, which is called Potential GDP.
Potential GDP has a particular meaning: it is the maximum level of economic output that can be produced without pushing up the price of labor and capital inputs to a point that would cause producers to mark up the prices of output. More succinctly, it is the highest level of economic production that can be reached without causing generalized inflation.
The level of Potential GDP over time also depends on technological gains over time. Technology gains — also called productivity — can be the most dynamic source of additional production in the long term (and will become an increasingly important driver of growth in the future).
From here, if aggregate demand further exceeds Potential GDP, production will continue to grow, but this would also generate more scarcity of inputs. This would in turn make inputs more expensive, causing producers to pass through those higher costs to buyers in the form of higher prices.
When actual GDP spending reaches Potential GDP, as occurred in February 2018, this is the textbook time for the central bank to tighten money in order to slow down the demand side of the economy and thus avoid an acceleration in inflation. The Federal Reserve actually started that process in December 2015, when GDP spending began its long catch-up trajectory to reach the economy’s Potential.
Labor Department data released in recent months strongly suggest that demand has fully caught up with Potential GDP. In October, there were employment gains of 250,000, wages increasing at a 3.1% rate year over year, and the unemployment rate contracting to 3.7%. This is well below the 5% “natural” unemployment rate that policy makers were willing to accept for a long time to avoid faster inflation.
What has transpired in this long and deep recession and the path to recovery? The graph below shows the path of actual GDP spending relative to Potential GDP, as estimated by the Congressional Budget Office. Notice the CBO’s estimates for the Potential GDP growth path are updated each year depending on the available level of inputs (labor, capital other resources and its projections for productivity growth). For reference, look at the estimate for Potential GDP in 2007 and its estimated growth path over time. This is the red line above all the other Potential paths.
However, when actual GDP — the demand side of the economy — fell so far below the supply Potential in the recession of 2008, it set off a dynamic that crushed future Potential paths. How can an economy’s Potential contract? One factor that can depress Potential GDP is unemployed workers dropping out of the workforce, thus shrinking the pool of available labor. Furthermore, excess capacity causes additional deterioration in Potential output as businesses decrease their investments in productivity enhancements and in plant and equipment that physically depreciates.
This trend of contracting Potential during the Great Recession, in which capital was allowed to deteriorate, also had the effect of exaggerating the depth and length of the recession, as spontaneous shrinkage of capital simultaneously reduced business investment spending during the Great Recession.
Hence, we can see that in each year during the Great Recession, the estimated level and growth rate of Potential declined relative the previous year — so by the end of the decade of recovery, the Potential target path was much lower compared to the 2007 projection.
On the demand side, it turns out that the period of excessively easy monetary policy during the recovery did not stimulate actual spending enough to catch up to the lower-lying Potential paths that would come in the next few years.
Actual GDP finally began to catch up to Potential in 2017, resulting from a marked change in the economic environment. This was largely the result of highly expansionary fiscal policies of spending, tax cuts and accelerated depreciation. These policies increased the growth rate on the spending side of the economy enough to reach the lower Potential trend estimate for 2017. All it took was spending growth in the 3% range to cause the convergence of Actual and Potential economic output.
But what Potential path did Actual GDP reach? It was not a GDP spending recovery that returned the economy to the estimated Potential that existed prior to the Great Recession as calculated in 2007. Rather, it just managed to reached the lower 2017 Potential projection.
The accelerated wage growth and exceedingly low unemployment rate reported in October are evidence that Actual GDP has become in sync with Potential GDP. The irony is that the catch-up of Actual GDP spending to Potential GDP had as much to do with the collapse of the Potential paths which dropped down to the Actual level of GDP spending, rather than Actual spending reaching the prior peak of Potential economic activity that had been estimated a decade earlier (the red line in the chart).
At this point in the recovery, the “reserve army of the unemployed” (those who dropped out of the labor force during the recession) is essentially depleted. They have returned to the workforce and are now counted among the employed. However, gains in Potential growth going forward will also be restricted by the attrition of Baby Boomers from the workforce, as they are starting to retire in greater numbers as they reach 70 years of age.
Hence, from here on out, the supply-side growth rate of Potential GDP will rely increasingly on capital input growth and investments in productivity gains given the restricted labor force growth. Fortunately, promising technologies having to do with robotics, artificial intelligence, drones and other exotic production enablers are on the horizon.
Indeed, business investment spending for plant and equipment will increasingly contribute to both the demand side as well as the supply side in this environment. Overall, the future is likely to be more inflation-challenged with adverse pricing of fixed-income securities. Expect the Federal Reserve to be tempted to move the short-term interest rates upward, with the only question being whether the President will challenge it.
This is certainly a new perspective on the macro-environment in which inadequate demand and shrinkage of Potential is no longer the great issue, but rather the more desirable “problem” of reliance on capital for growth.
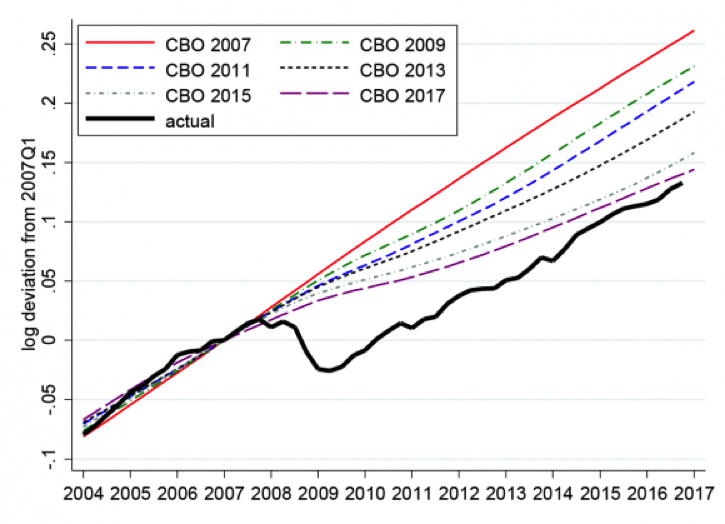
Actual and Potential GDP over Time: Before and During the Great Recession