↓
 

The Spellman Report

The Spellman Report, Where the Economy and Markets Meet

The Spellman Report
  • About
  • Blog
  • News and Views
  • Video
  • Investment Management
  • Speaking Engagements

Search Results for: "economic research"

Update: Economic Policy Has Reached A Dead End And The Recession Continues

The Spellman Report

Unemployment narrowly defined is at near 10% or broadly defined is near 17% if it includes those who have quit looking (job search is expensive) and those who are working less than their preferred full time. Also, the length of the economic downturn is approaching two year, which makes this the longest continuous Post WW II downturn.

Simultaneously there are claims that the recession is over. To reconcile these conflicting ideas requires a comparison of actual GDP spending with the GDP that would occur if our resources of labor and industrial capacity were at reasonably full use. This latter concept goes by the name Potential GDP.Potential GDP is a supply side measure of the amount of GDP capable of being produced given available labor and plant and equipment would not add to the inflation rate. While actual GDP could be and is often higher than Potential GDP in economic booms, this implies that the marginal GDP demand is contributing to a higher inflation rate.

In the post WWII business cycles the opposite occurs during recessions when actual GDP spending or demand is less than the GDP that would occur if available resources were employed. In this case the difference is called the deflationary Gap, as this represents soft goods markets. In the current situation actual GDP spending is about 7% less than Potential GDP, which is contributing to an actual deflation. While Actual GDP spending is well below Potential GDP, it has bottomed and has turned around, and it is beginning to grow at a 3% rate. This should be the case given the magnitude of fiscal stimulus and the extraordinary Federal Reserve provision of almost costless liquidity that is reaching certain few entities.

While the actual GDP growth rate has turned the corner from a position far below Potential, this does not necessarily imply that spending will catch up to Potential for several reasons. First, Potential is a moving target that is growing every bit as fast as actual GDP spending is growing at this time if not more. Every month there is an approximate growth of 125,000 new labor force entrants and productivity gains (the flip side of corporate emphasis on efficiency) elevates Potential GDP. In fact the corporate emphasis on cost cutting is allowing more to be built with fewer resources. So GDP spending is chasing the moving target of Potential GDP and is not gaining on it despite the impressions created by the growth chatter. This is in contrast to past recessions when the turn in GDP occurred and tended to catch up to the moving target of Potential GDP within two or three years,implying that GDP spending required growth rates of 5 or 6% during the catch up years.

This leaves the question of whether the “official” recovery from recession by the National Bureau of Economic Research will be proclaimed based on the growth of GDP even if GDP is not in catch up mode and unemployment continues to grow, a situation that might be unique in the Post WW II era. A proclamation by the NBER that the recession is over is based on both qualitative and quantitative issues.
The only thing clear is that if such an assessment is made that it will, in turn, ramp up financial market expectations of rapid growth to full recovery.

DEMAND SIDE HEAD WINDS

The ability of the economy to produce accelerating growth from here to catch up to the moving target of Potential GDP is questionable given the major head winds faced by the economy. This could be a long list but the major items are the following:

The economic growth period of 2003 to 2007 and the economic shock that followed (GDP down at a 6% rate) were not simply a response to rising and falling income as with the typical recession. Rather the growth and decline were a wealth financed economic expansion and contraction. The method for translating consumer wealth into current spending was borrowing, with the majority of the borrowing collateralized by a home. This was called mortgage equity withdrawal. So the economic expansion lead to house building (or refinancing) and debt against said asset. When this ran its course the goods were consumed but we were left with an over-supply of houses that can’t be sold and more debt than could be serviced from income.

This transformation of wealth into spending left a residue of an overhang of approximately 6 million homes (plus commercial real estate) which amounts to a normal three year absorption period though the absorption rate is far from normal. It also left a residue of decline in wealth as the excess houses have deteriorated, housing prices have declined and the mortgage and consumer debt remains unpaid though the consumer is struggling to do so. The extent of the intended consumer deleveraging as seen on page 3 that has taken place is still minor and we remain quite a long way from recovering to theconsumer’s typical debt to income ratios. This effort to service both interest and principle on the debt in turn reduces consumer spending.

Furthermore this wealth liquidation period has left the financial institutions of all varieties and across the globe holding these loans as assets on their books, and the declining values of those loans, in turn,lead to a variety of headline-creating financial meltdowns of institutions as their assets eroded, which in turn eroded their capital after the accounting adjustment was made. These institutions, for the most part, are still barely hanging on and need to shrink their balance sheets to be in proportion to their remaining capital bases. Hence banks are pressing all those who can be pressured to repay loans by raising interest rates where possible. Hence consumer credit and commercial and industrial loans made by commercial banks (as seen on page 2) decline as the consumer deleverages (see page 3). The question is: are loans contracting because borrowers wish to pay down loans or because the banks are not willing to extend the bank’s balance sheets. The answer could be one or the other or both. In this case it is both as a lack of bank and financial institutional capital still keeps most commercial banks in a non-lending mode, with over 400 banks on the FDIC list waiting in a queue to be resolved or liquidated.A risk analysis firm, IRA, places the number of commercial banks in failure at over 2,000 out of the total of approximately 8,000 commercial banks as seen on page 4.

THREE PATHS FROM HERE

Observers discuss three possible paths going forward. The first is the typical Post WW II path of accelerating GDP growth and the return to Potential GDP once the turn has occurred as economic growth feeds on itself. The second emphasized the struggle to overcome the debt build up and efforts to reduce debt and replace insolvent banks with banks that meet capital requirements. The third path is this uptick GDP, is nothing more than a head fake, and we will back down into another leg of the recession when additional lending failures can no longer be papered over with loans that require no accounting adjustment to falling collateral or delinquency or to lower market prices.

THE LONG SLOW RECOVERY PATH

The Long Slow Recovery path pays its respects to the implications of the wealth destruction implications as outlined above. In this view GDP struggles to catch-up to Potential GDP because of the very lengthy process of absorbing excess houses, the time required to resolve the insolvent financial institutions and replace them with solvent ones and for the consumer sector to shed its debt overhang. The recapitalization of the “too big to fail” banks occurred quickly with TARP fund, but the great majority of banks are still in “zombie” mode.

The consumer de-leveraging is proceeding slowly as the consumer is shedding debt at the rate of $250 Billion per year whereas the debt was created at the rate of $600 Billion per year. If it took 5 years to build the debt, at the current rate it would take a decade or more to accomplish the deleveraging.

Other mega issues also must be confronted that will slow economic growth, and these include a trade deficit that will not go away so long as US wages are well above emerging market wages, a fiscal deficit out of control and all efforts to control the fiscal deficit will be anti-growth, and the prospect of continuing capital exodus from the US which is well underway. In this view of the future, GDP could grow but not at a sufficient rate to catch up to Potential, leaving a jobless recovery that in itself creates economic uncertainty which constrains spending.

THE “W” RECOVERY OR THE DOUBLE DIP RECESSION

The third among the popular versions of the future would be those who see the “W” recession. That is, the GDP uptick of this quarter will be followed by a double dip recession. The logic of the W, or double dip recession, is we will experience all the above problems in the slow growth path but the still to come additional financial write downs (especially from commercial real estate and the slow motion recognition of residential mortgage defaults and foreclosures from the large excess housing overhang) will continue to neutralize the ability of the commercial banks to put to work the prodigious liquidity supplied by the central bank. Until the banking system is restored to capital compliance there will be no recovery, and without sufficient funding to resolve insolvent banks, regulators will continue to allow and encourage the cooking of the books and pretend the banks are solvent. This is a policy know as “pretend and extend.” This was made official this week rather than chartering new solvent banks without any contingent historical losses that would be capitalized by the market if allowed to be formed. In other words we are heading down the path of Japan’s lost decade of “zombie” banks.

The Typical Post WWII Recovery Path and Financial Market Mania

The recovery in US fixed income and equity pricing thus far in 2009 are shown clearly on pages 5 and 6 of the handout in terms of appreciation of corporate fixed income and the impressive P/E ratios prevailing in the equity market. This leads to an interesting and intriguing question. If the majority of economists see a protracted sub-par GDP growth rate, what scenario are the financial markets pricing?There are many facets to this issue.

First there it seems clear from analysts and market participant’s statements that the projected growth path ahead resembles all other post WWII recoveries: that once a bottom has been established the retracing of GDP back to Potential and corporate earnings growth will accelerate. Why? Well that’s the way it’s been in the past. When pressed for more analytics, much has been made of corporate gains in efficiency from cost cutting in an effort to maintain cash flow and earnings without recognizing there are two sides of that coin. The cost cutting mostly has fallen on labor which in turn puts a dent in income generation and spending.

Other reasons for this occurrence must rest on, at least in the early stages, the realization that the liquidity in the corporate debt market has allowed many firms who can reach the capital markets to refinance their balance sheets. This has allowed the reduction and extension of debt which reduces their immediate vulnerability to soft goods markets and bankruptcy risk.

The Carry Trade or Financial Leverage

Other factors creating the whoosh of the corporate security market advance are the return to the carry trade as the circumstances for a carry trade recovery have been present. The Carry Trade is simply highly leveraged purchases of assets financed by very inexpensive financing terms when large spreads to existing fixed income exist. Once the market settled down after the 2008 crunch, the low volatility also contributed to a willingness to enter into leveraged positions, especially when financed by US Dollar lenders, hence removing foreign exchange risk. The Carry Trade is often undertaken by hedge funds or investment banks. The cheap funding source follows from the exceedingly low short term market interest rates available. One must wonder who the lenders are if commercial banks have hit the wall in terms of lending capability. It seems the Repo market is placing institutional short term funds from endowments, pension funds, insurance companies, etc. at rates near the Fed funds rate on an overnight basis. Hence financial leveraging does not require solvent commercial banks.

Quantitative Fiscal Policy: The Textbook Free Lunch Version

Public policy to extract an economy from a recession predominantly rests on the shoulders of fiscal policy (tax and spend), monetary policy (lend and spend) and foreign exchange management to induce foreign spending for domestically produced goods. These policies to extract the US economy from a recession have reached a dead end. Let’s take these in turn.

It has long been textbook lore that fiscal policy in the form of government spending or a tax refund generated additional private spending and the additional private spending relates to the government spending as the fabled “multiplier” effect. This occurs because one dollar of government spending results in income generation from the production of the goods the government purchases. When the income is distributed to labor, the great majority of the funds are then spent on consumption goods.Since each consumption good purchased creates additional income and, in turn, round after round of additional consumption, the total effect of a Dollar of government spending is some large multiple (perhaps 10 if the only offset is a marginal savings rate of .1) of the government spending.

However economists have found the theory would only work if there are no offsets to this chain reaction. That is, no other negative frictions on spending occur. This is the “free lunch” version of the multiplier, but, in reality for some time, some economists, most notably Robert Barro of Harvard University, have measured the multiplier effect of government spending and found the effects to be considerably smaller. Over the past few decades he estimates the multiplier effect to be .6, which isless than 1. That is, for each net dollar of government spending, the total spending effect generated,including the dollar of government expenditure, is less than the dollar spent by the government.

Fiscal Policy without the Free Lunch: Fiscal Policy Has Reached a Dead End

A multiplier of less than 1 can only happen if there are offsets to government spending. The concept of the offsets reducing the multiplier to even less than 1, in general, are the result of costs being imposed due to the debt financing that made the government spending possible. So what are those effects? Well first, if the government spending is financed with Treasury debt, this necessitates that financial resources be bid away from private use which places upward pressure on borrowing costs and reduced availability of credit that adversely affects, not only the consumer, but also business investment and state and local governments’ spending. Additional offsets to total spending occur when the expansion of the government deficit creates expectation that the government will be forced to eventually balance the fiscal budget and resort to higher taxes, which offsets the propensity to invest and even to consume.

The pressure to raise taxes comes when the market starts to lose confidence in the ability of the government to roll over its larger debt relative to income. That is, sovereign risk begins to be priced into Treasury rates which in turn raises the cost of capital to all private borrowers. For example, this occurred at the end of the Reagan-Bush Presidencies. The attitude of “watch my lips, no new taxes” was disturbing to the credit markets and caused sovereign risk to be priced, which in turn resulted in higher taxes despite the pledge of no new taxes. Similarly last week the Obama administration announced that it will address fiscal fixes. This must be code for raising taxes or selling government assets.

Other offsets to government spending come from the higher debt service costs, especially when the debt is held by foreign entities. Lastly, the market begins to believe that the sale of the added Treasuries can only occur if financed by the central bank known as the monetization of the debt which on the face of it looks to be creating ultimate inflation and higher associated interest rates.

Today all these factors are operating to add a cost to government spending in the form of offsets to private spending to make the government spending policy almost without any effect at all. For example the fiscal year for the government recently ended with a $1.4 Trillion fiscal deficit but yet GDP or total income and spending declined roughly $800 Billion.

No doubt today the effects of government spending are even more muted as recent tax refunds or rebates of taxes previously paid have resulted in the consumer saving virtually every penny of the rebate, resulting in a multiplier of zero.

The Government Debt to Income Ratio is Skyrocketing and Creating Sovereign Risk

While the inability of the government to propel the economy forward due to the offsets to government spending or tax rebates, there is even a greater problem in trying to move the economy forward using fiscal policy that is debt financed. When a dollar is spent a dollar of government debt is created, but the when the income produced is less than a dollar there is a large marginal increase in the government debt to income ratio. In the past fiscal year the US debt to income ratio shot from .84 to over 1. See page 9 of the handout.

For those who examine credit worthiness the debt to income ratio is an important metric, and the US’s debt to income ratio will continue to spiral upward if fiscal multipliers are less than 1. This is the astounding and grave implication from debt financed government spending when the offsets lower the multiplier below 1. Government spending needs to be thought of as investment in income generation,and if the income produced to ultimately pay for the debt is less than the investment, we have found the formula for sovereign default. To make matters worse the political response is let’s do more of it.

Monetary Policy Has Reached a Dead End

During October 2008 at the time of the intense credit meltdown, the Federal Reserve stepped into the markets and made loans to non-member bank financial institutions, corporations and even began purchasing consumer debt derivatives. When the Fed loans or buys financial instruments, the otherside of the Fed’s balance sheet represents how the loans were funded. In this case the funding was secured by currency issuance and member bank deposits both of which satisfy commercial bank liquidity requirements. These counter items to the Fed credit expansion are called the Monetary Base as seen on page 13. The significance of this is that as the result of the Fed supporting credit markets, commercial banks were provided with sufficient liquidity to fund loans in amounts equal to the total of existing GDP spending. Since liquidity is typically the constraint that limits bank lending, it was generally thought in the months following that the Fed had unleashed an inflationary super bubble that would result from all the lending and spending that hypothetically would take place.

While the great expansion in liquidity did not create the lending and spending due to the banks not meeting capital requirements, none-the-less this unleashed inflation expectations of a high order of magnitude. The inflation expectations lead to increasing the interest rate, which is the last thing the Fed wished to see in a serious recession. To counter this adverse perception, the Fed announced its intention to “exit” the market early last summer. This had the intended effect of reducing inflation expectations and interest rates came down as a result, but it did serve to make clear to the Fed that the market would not tolerate any further increase in its balance sheet. Also, the Fed had to backtrack on its original announcement that it would finance near a Trillion Dollars of the Federal deficit and instead put the Treasury on a “budget” of $300 Billion for this year. Clearly the Fed has hit the limit of how much money it can infuse in the banking system without adverse market tolerance. The Fed is up against the wall and will likely need to make good on “exiting”, whatever that will mean.

Exchange Rate Policy has Reached a Dead End

China has been intervening in the foreign exchange market to prevent her currency appreciation when she runs a trade surplus and is the beneficiary of capital inflows as well. In turn many countries who compete with China feel to remain competitive they also must sell their currency vs. the dollar to keep it from appreciating and still be able to compete with China in the export markets. Furthermore, Brazil has just announced a tax on capital imports to restrain the effects of said capital inflows in its currency value. All these foreign exchange interventions are designed to keep Emerging Nation currencies cheap relative to the US Dollar. All this intervention supports the dollar and prevents the US Dollar and US goods from being competitive in world markets.

Now if the US decided it could play the same game and sell its currency to cheapen the dollar to encourage exports and a US economic recovery (which it hypothetically could do), there are constraints from carrying this out. The major constraint is the US is foreign capital dependent to fund its fiscal deficit, and intentionally driving down its currency will drive out not only future capital inflows but would encourage the $6 Trillion net debts with the rest of the world to pull out of the Dollar.

The US dead end in exchange rate policy comes from this clash of objectives. A cheap dollar to encourage exports would drive away scarce capital and cause the US Dollar to more quickly surrender its reserve currency status.

Policy Alternatives

The policy alternatives not being considered actively are those that are somewhat “out of the box.”They are decidedly not the standard macroeconomic recovery tools which we have previously discussed which are not effective in a debt ridden deflationary economy. First, one would need to recognize that consumer insolvency is de facto widespread though unresolved and the same can be said for financial institutions generally. The resulting no-spend, no-lend prevents any stimulus, whetherfiscal or monetary, to be effective in combating the imbalance that exists. There are a few courses of action however. Basically they are efforts to either inflate asset prices or reduce debt.

The first would be to restore housing prices which would have a positive wealth effect on the consumer, and it would give greater value to mortgage debt which is collateralized by houses. This in turn would restore financial institution asset values that in turn would effectively recapitalize banks.There would be no need or considerably less need of public capital infusions via TARP, less need to close banks, and less need for a private recapitalization of the banking sector.

How might this be accomplished simply is through reducing housing supply. At this point approximately $300 billion of TARP funds have been repaid which could provide the funding to purchase approximately 3 million or half of the housing overhang from banks as they are foreclosed and then demolished them.This contraction in supply would bring about a restoration in housing prices and in mortgages and residential mortgage backed securities as the collateral behind the mortgages are restored in value.While this is fundamental economics, it flies in the face of a moral sense that while public funds are generally spent with little to show in terms of welfare, this would seem to be an over-the-top outrage,as it explicitly makes the statement that government spending undermines welfare. However, the program could be carried out as a “condemnation” policy as these empty houses have menacing neighborhoods effects.

Another possible way to appreciate assets is the original TARP idea, which proved to be require a much large capital purchases program than what was funded. An indirect way though has been found by lowering interest rates to the point where the carry trade is inflating most but not all asset categories.

Another way to accomplish the goals of reducing debt and add to the value of assets is to have a purposeful inflation, that is, inflation by design. The purpose of this would be to devalue the over-indebtedness in real terms and cause the market to run to housing as an inflation hedge. This would eliminate the common problem of consumers being “upside down.” While the Fed can’t create inflation via consumer spending currently, inflation by design could be carried out by the Treasury taking the Fed under its wing as has been done before in WWII (The Accord) and effectively in the Civil War (The Fed didn’t exist at that time) with the Treasury printing currency to pay the government’s bills. This did the trick of creating market demand out of new money issued that was inflation-generating.

Lastly, national debt forgiveness, that is a debt cram down, is a desirable alternative to reduce private indebtedness. Doing this quickly by legislation is superior to the long and drawn out and costly individual bankruptcy process that accomplishes the same result but at a much higher transaction cost in terms of lengthening a recession with greater income loss. This is also superior to a private effort to deleverage that has produced perhaps $500 billion of reduced debt by consumers and businesses in the last year but at the cost of increasing national debt by $1.4 Trillion.

The Anniversary Blues

The Spellman Report

Economic cycles have been around for a long time, and the National Bureau of Economic Research keeps score, so to speak. US cyclical expansions since 1900 have averaged just short of 5 years in length. The shortest had a duration of but one year, in contrast to our current expansion, which began in the Great Recession low of nearly 10 years ago. If the economy continues to grow through next spring, this would become the longest expansion since the NBER began counting 118 years ago. Meanwhile, the stock market has been ascending for virtually the same amount of time. This is unsurprising, as the two are closely related.

The extended growth of the economy and the stock market now has some investors unnerved, particularly approaching milestones such as the tenth anniversary of the Lehman Brothers implosion. Whenever such an anniversary comes around, a cottage industry of analysts predicts the next bust on the presumption that somehow time is up. After all, analysts need to sound alarms to maintain their respectability in case one were to occur. In the forecasting game, bragging rights are earned by sounding the alarm ahead of a recession; false alarms are tolerated and even considered preferable to totally missing the next downturn.

So where do we stand today? Are we on the edge of another correction, or is more growth on the horizon?

First, some background on the boom/bust process. Relatively fast economic expansions require spending on a particular type of good (or goods) to accelerate at rates above the long-term average. The increased spending on the “boom item” in turn generates additional income for those who produced and sold those items. These producers and sellers then spend their newfound income on other types of goods in the market, creating a multiplier effect that can fuel an extended recovery.

Furthermore, the acceleration of spending in excess of income tends to lead to borrowing, so economic expansions come along with credit expansions. When the economic expansion ends, the debt that financed the expansion now accelerates the ensuing recession as more income becomes devoted to debt reduction.

The economic expansion proceeds until excess demand for the boom items gives way to an excess supply of it. When the borrowing and spending stops, income growth lags and defaults start to pile up. Therefore, the first cousin to economic distress is financial distress, most typically with bank lenders.

Additionally, stock market retreats become a second cousin to the slowdown in economic growth. When the market dips, fewer boom and secondary items are sold, and they sell at lower prices and smaller profit margins.

That is the general outline of the business cycle, accompanied by a lending cycle and a stock price cycle.

As an example, the tech boom of the 1990s was driven by spending on personal computers and software. When the market became satiated, sales slowed, and the ensuing tech bust led to monetary policy that generated easy money to support spending. The main beneficiaries of this policy became the housing industry, as consumers borrowed the cheap money and spent it primarily on new or existing houses. That became the boom item that propelled the next economic expansion — until that market also reached satiation.

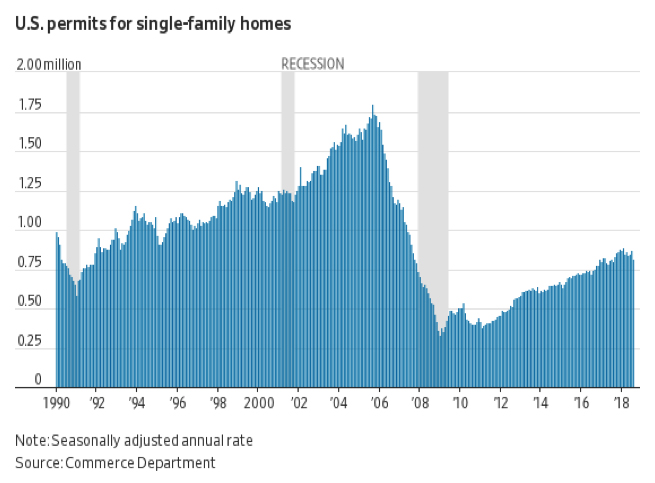
The chart below shows housing permits by year relative to recessions, which are shown in a gray shade. You can see that housing really got into expansionary mode on its way to becoming the next boom item after the 2000 tech bust. The housing market extended itself until it was overdone, and it actually began to decline before the full-fledged bust of 2007-08, with new housing permits falling from a peak of 1.75 million to approximately 350,000 per year.

Faced with another recession, the Fed this time put the pedal to the metal with its Quantitative Ease, which drove interest rates down to the absolute lowest borrowing rates in history. In the wake of the real estate bust, the chances of a successful housing-driven recovery were destined to be slim. Indeed, in the recovery that followed, annual GDP growth struggled at the 1% rate and the recent eduction in housing starts indicates it was running out of steam in the last year.

If the present economic expansion was dependent on easy money to continue the expansion based on consumer durable goods, then I would have to agree with the naysayers with the anniversary blues and are predicting the next recession.

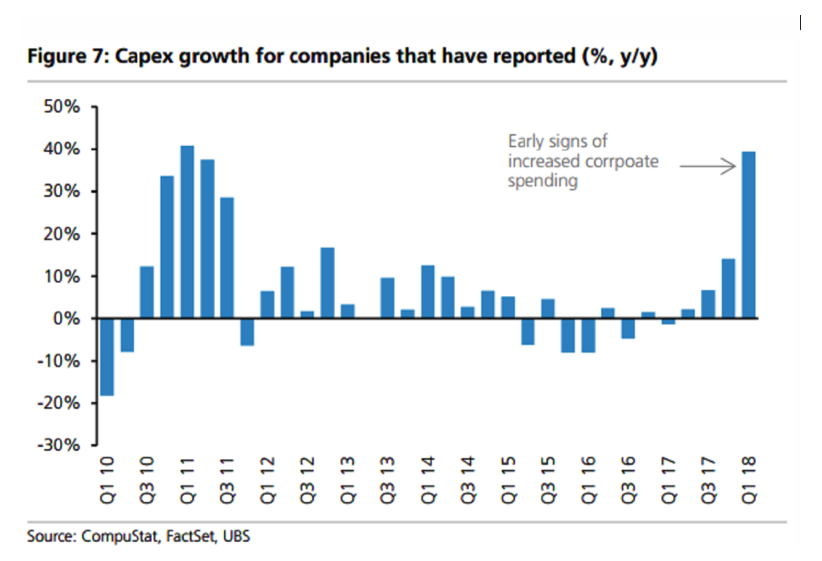
However, has life sprung back into the economy more fundamentally in the last year, almost out of nowhere from a different source. This time, rather than housing, the boom item came in the form of invention leading to business capital spending known as Capex.

The “animal spirits” propelling today’s business sector growth are derived from a significant reduction in corporate taxes, accelerated depreciation, the low tax rate applied to the repatriation of foreign earnings and the removal of regulatory constraints. The combined effect of these factors has put the economy into an old-fashioned business investment boom.

Businesses have responded to these incentives by investing in promising new technologies based on artificial intelligence, robots, machine learning, and semiconductors along with new product development in biotech. These new boom items are driving the economy and stock market forward.

In addition to ramping up the demand side of GDP, business capital spending also has healthy supply side contributions. It positively affects productivity, which reduces costs, widens profit margins, affords higher wages with workforce expansion, and acts as a deterrent to inflation. This is a very different expansion as compared to a monetary policy driven debt financed consumer durables spending binge.

This climate of innovation and technological development is creating new leaders in the stock market while also creating losers as markets evolve to new products and suppliers. Market indices are rising but with large differences in the pricing and potential of the disruptors and the disrupted. Stay on your toes, as some brand names will be replaced and disappear.

If the expansion reaches a record length in 2019, that will be an anniversary worth celebrating and the momentum should carry us as long as profit is being generated from break through products and processes as it is doing now.


The Point of No Return for Government Debt

The Spellman Report

Economic growth in the developed world is falling well short of the post-WWII experience, and there are identifiable causes.

Globalism — the opening of global trade — has caused developed economies to lose exports to lower-wage emerging nations and is but one factor. Another is the slowing of population and labor force growth (and, in some cases, both are shrinking). This contributes to the problem of slow economic growth as it restrains both aggregate supply and demand.

Furthermore, when populations stop growing, what outpace economic growth are age-related government entitlements as the age-profile of the population becomes top heavy with retirees. This, in turn, means taxes rise disproportionately on the backs of the relatively fewer workers, or the country — more realistically — resorts to debt financing.

Entitlements accelerate the accumulation of government debt now being piled on top of decades of Keynesian deficit spending that were an attempt to nudge higher growth rates.

It has long been a vague concern that government debt accumulation would be the ruination of an economy, and that sovereign defaults would occur as they have many times in that past. That issue is now front and center in both Europe and Japan, with the U.S. perhaps a decade behind.

Larger debt loads, however accumulated and whether from Keynesian economic stimulus, entitlements, war financing, or financial guarantees, cause tax rates to be higher than would be otherwise be necessary to pay yesterday’s incurred interest. It becomes a struggle for a government to merely pay interest without the possibility of retiring debt.

For example, in Japan, the debt-to-income ratio is a staggering 250 percent. This means that despite very low interest costs on government debt, 43 percent of tax proceeds are devoted to paying interest on its past debt.

Raising tax rates to pay debt service impacts the present as it becomes a negative incentive for investment spending. So past debt retards today’s economic growth.

The great danger of a high debt-to-income ratio is that it becomes self-reinforcing: We induce higher debt ratios not only via higher taxes to pay interest but also because the resulting economic slump unleashes Keynesian automatic stabilizers that have been built into an economy’s spend-and-tax reflexes.

As an economy’s growth rate slows, this kicks in income maintenance programs like unemployment support. At the same time, a slumping economy’s tax revenues erode more than in proportion to the slowdown in economic growth, which is a by-product of a progressive tax structure.

For example, in the first year of the Great Recession, U.S. government debt expanded by 15.8 percent while income declined by 2.8 percent, and together they ratcheted upward the debt-to-income ratio.

The economic slump produced by debt adds to government deficits resulting in yet more government debt and more taxes, which in turn reinforces the slump. The causation runs both ways: debt slows growth, and slow growth widens country deficits and accumulates debt.

What is being described is a self-reinforcing endogenous debt accumulation process in which the debt-to-income ratio rises until it can no longer be financed, resulting in a sovereign default.

The critical threshold when the self-reinforcing process of debt accumulation outpaces income growth has been aptly called the “bang point” by Reinhart and Rogoff (R & R). Their research, contained in their book “This Time Is Different,” shows that over many years, for many countries, that the threshold for debt to grow exponentially occurs when the debt-to-income ratio reaches approximately .9 — that is, when a country’s debt is 90 percent of its GDP.

R & R find that on average, for many countries, when that threshold level of the debt ratio has been reached, economic growth becomes retarded by 1 percent. In today’s world, much of Europe (and certainly Japan, too) is well above that point, and income growth has certainly declined and is barely positive.

For the U.S., at a debt-to-income ratio of 100 percent, economic growth is also being sucked into the endogenous web of debt in which, at best so far, GDP growth appears to be have been retarded by 1 percent annually.

The U. S. finds itself this year in a relatively weak cyclical upswing in which the growth of income and debt are both rising at approximately the same 2 percent rate so that the debt ratio is being maintained at the present time, but any slump in growth accelerates the debt ratio.

As a deterrent to debt accumulation, a heroic attempt is taking place in Japan and the U.S. to reduce the interest expense of government debt. Europe, via its European Central Bank (ECB), has recently engaged in a similar battle.

The debt service reduction is being described as Quantitative Easing and is being discussed and sold to the public as being a monetary policy to offer lower interest rates to stimulate interest rate-sensitive private spending. That is, low rates to stimulate growth.

Indeed, many of the central bankers are well trained Keynesians and they think that way, but to the political class, the central bankers are used as pawns to neutralize the government’s debt burden.

There is much debt service to be neutralized at current levels of debt, especially in Japan and Greece. What greatly complicates the problem of maintaining debt service with a high debt ratio is that the government bond market, when it senses that the debt problem is getting out of control, will only finance the government’s debt with elevated interest rates that imbed a sovereign risk premium.

To get a sense for a country’s interest cost exposure to sovereign default pricing, take a simple example of a debt-to-income ratio of 1 and an (unrealistic) interest expense that averages 1 percent on all government debt issues. In this case, taxation would only need to capture 1 percent of a nation’s GDP to service country debt. This expense is manageable.

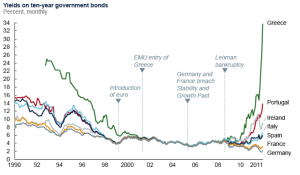
But to be more realistic, sovereign bond yields on 10-year debt maturities are shown below for several different recent European sovereign bond market eras.

Untitled


Prior to the common currency that arrived in 1999, when the Euro countries were on their own (in the sense of no support from by each other or by a central bank), sovereign yields were priced to reflect sovereign risk.

At the start of the common currency in 1999, the sovereign rates came together at Germany’s base rate during the honeymoon of the Euro zone when it was presumed that the stronger countries would come to the aid of the weaker if need be — and if not, there was a central bank to provide assistance. Also debt control was a pre-requisite to be a member of the Euro zone.

This presumption of aid to the weak became questioned after the financial crisis, and there was a weakening of country debt control. This relevant era began in 2008, at which time the market priced country vulnerability with little or no help from neighbors or by the central bank because “monetary finance” (or central bank financing of governments) was still taboo.

That environment reveals clearly how hard markets will punish sovereigns with debt problems. High single digit sovereign yields existed, and Greece, which was headed for its first default, experienced a 30 percent market cost of finance for 10-year maturities.

In this case, for a country with debt equal to 250 percent of annual GDP, and if its sovereign average cost of funding for all maturities was merely 10 percent, that country would need to capture fully 25 percent of GDP to pay interest alone without any of the other costs of government being covered. There would be debt cost of that magnitude likely for both Greece and Japan.

That is the process by which default is brought on when the debt-to-income ratio reaches the bang point. It might take a few years, but the process grinds on until the income lost attempting to tax and service the debt becomes impossible to bear.

So, in a last ditch effort to avoid default, the central bank intervenes with quantitative easing to reduce interest rates paid by sovereigns. QE is in process in Europe, but as things currently stand, Greece’s sovereign debt is not investment-grade and, hence, is not eligible for purchase by the ECB unless the rules are bent or the rating is changed which is a likely response in the pragmatic business of saving the sovereign, otherwise known as “Whatever it takes.”

Alternatively, Greece would need to drop out of the currency union, likely default on its debt in whole or in part, and go back to its own currency from which they can continue to play the money game to depress interest expense. In the case of Japan, the pretense continues, but they are past the bang point and — short of some new exogenous source of demand for their products revealing itself — they are sinking deeply into the morass of debt and debt service.

But will central bank QE really contain the debt service problem? The answer has to be no because the side effects of the debt solution becomes its own problem.

With such low investment returns in-county, capital flees to higher-yielding locations and, without capital, there is no financing of private investment and the real physical capital stock becomes a relic of yesterday. This erodes income and raises the debt-to-income ratio further.

Once having reached the bang point, QE is too late and counterproductive


Sign up to receive the Spellman Report. Bracing financial and economic insight. Now with free delivery!

Regulation, Gravity and The “Isms”: The Education of a President

The Spellman Report

obamaEconomic regulation and its counter-effect on economic growth — a rising background issue until now — has just vaulted to the front pages with President Obama’s recent speaking tour, signaling a redirection of policies and mischief ahead.
The concern about regulation today, as always, is that it is leads to a hardening of the economic arteries that restricts entrepreneurship and negates the income and jobs that follow.

In limited circumstances, well-structured regulation can be worth the economic cost by yielding benefits most found in the areas of health, safety and the environment, as China can attest.

But most economic regulation is mindless and costly — not just in terms of opportunity cost, but also government administrative costs and the reporting and compliance costs that come with operating under a regulatory regime. All of that reduces real economic activity and real income, so regulation is effectively an out-of-the-limelight, macroeconomic issue.

When the Fed complains endlessly about “headwinds” to economic growth, it implicitly recognizes regulation as a ghost factor that neutralizes its own monetary policy. This leads to the economy repeatedly falling short of the Fed’s expectations and yet more accommodative policy, as occurred this week.

When R.A. Posner studied the common causes of regulation in 1974 (another regulatory era), he observed that regulatory intervention is a tempting option for those in government who don’t believe that market prices and allocation mechanisms create desired social or economic outcomes.

Posner also indicated that income inequality is a further cause for governments to turn to regulation.

Hence, there is nothing like a Great Depression or Great Recession with depressed income and wider inequality to become a regulatory breeding ground that indeed deepens the macroeconomic quagmire.

Slowing economic growth comes about when regulatory barriers and costs makes production less viable, at least in the U.S.

As former Intel CEO Paul Otellini explains it, even the job- and income-generating computer chip industry is moving away, not just for production but also for R&D.

The decision to relocate or stop production altogether occurs when the rules of regulatory fiat restrict investor incentives to deploy capital and enterprise to activities in which prices and profits are rising, and divert them away from activities in which the reverse is true.

This is the heart of the system in which prices direct the commitment of resources, a policy that used to be known as laissez faire — a case for the passivity of central direction.

According to Wikipedia, “laissez faire stems from a meeting in about 1680 between the powerful French finance minister Jean-Baptiste Colbert and a group of French businessmen led by a certain M. Le Gendre. When the eager mercantilist minister asked how the French state could be of service to the merchants and help promote their commerce, Le Gendre replied simply “Laissez-nous faire” (“Leave us be”, lit. “Let us do”).”

But regulation becomes a costly visible hand of government that overrides the “Invisible Hand” in which Adam Smith also saw the market providing for wants as a superior guidance for outcomes.

As indicated above, the most fertile time to give rise to perceived needs for regulatory corrections to market outcomes would presumably be the shock of a Great Depression. Due to that and the exigencies of World War II, the command economy emerged out of Washington DC and bureaucrats, as they came to be known, overrode economic decision making.

And of course, it creates scarcity that markets do not rectify.

My views on the subject were formed early on. As a teenager I accompanied my father to Washington, where he testified at a hearing conducted by the now-defunct Interstate Commerce Commission having to do with the difficulties of obtaining trucking capacity, which was obstructed by a command-and-control agency for a myriad of perceived purposes — take your pick. For me, it was an introduction to government and a lasting impression of regulation. (I was impressed with the stately Hearing Room!)

By the 1970s, following decades of regulatory dead-weight loss, the wisdom of Washington’s visible hand was questioned by yes, a Democrat, Jimmy Carter, who lead the way to deregulation industry by industry and agency by agency, followed up in the 1980s by Ronald Reagan and Maggie Thatcher in the U.K. The repulsion of mindless regulation then appeared to be a bipartisan conclusion.

By 2007, celebrating 25 years of economic deregulation, Robert Crandall of the Brookings Institution calculated that the 25-year deregulation movement dating from Carter’s time had liberated the regulatory controlled economy and reduced prices by 30 percent in the industries it directly affected. Hence, deregulation represented a substantial gain in real income per person.

But alas, the celebration of the deregulatory gains in America was premature.

At the very time when Crandall was tallying the gains from deregulation, we were on cusp of a great financial/economic shock and a spreading war on terrorism that had the same one-two punch to send Washington back down the regulatory road as it did in the 1930s and 1940s.

In today’s environment, the regulatory and tax tone is simply anti-business, not just preventing new firms from getting off the ground, but also causing large companies to redirect activities to those countries where business is most welcomed.

To add to the compulsion for regulation in this Great Recession, the U.S. government is in a financial bind. Without the ability to legislatively change broad-based tax rates or benefits, it does so in a de facto way by putting its citizens through a greater burden of proof for tax deductions and eligibility to receive benefits as an indirect means of deficit control.

Art Laffer, a classmate who went on to be a champion of supply side economics, has studied the regulatory and compliance costs imposed from U.S. taxation. He deems these amounts to be 30% of total income taxes collected, increasing with tax complexity. That’s the situation we’re in now that the fiscal bind is ramping up.

Which brings us to Obamacare. Not only is there regulatory complexity and reporting to produce and receive benefits, but moreover the loss in aggregate efficiency in U.S. production could grow even larger. For example, John Mauldin reports that many businesses are reorganizing their work forces to deflect the Obamacare tax by working with subcontractors that employ no more than 50 workers each who work fewer than 30 hours per week.

But how do you document lost production from the loss of the cohesiveness of a work force? It would be like fielding an NBA basketball team with a group of underpaid rented part-timers on the way to their next hiatus. (Incidentally, to appreciate the role of player connectivity and continuity in professional basketball, take a look at Phil Jackson’s new book, “Eleven Rings”).

Also in this post Great Recession re-regulatory environment, let me not fail to mention the costs of financial regulation. There are crippling reporting and compliance costs involved, so multiple government agencies can judge the appropriateness of a loan for both borrower and lender in banking. As a result we are not using our financial resources provided by the Fed.

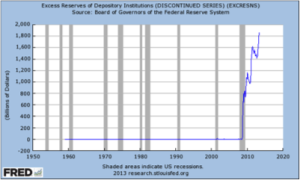
As the graph indicates, we are in an unprecedented situation in which trillions of dollars of excess commercial bank cash reserves are sitting on deposit at the Fed rather than being loaned out. While indeed there are other causes as well for the unloaned cash accumulation in commercial banks, financial regulation is under-rewarded for praise.

To attempt to document the growth of regulation, some have taken to counting the numbers of new regulations that have been codified which is more than alarming, but only implies economic loss without measuring it. Others count the number of regulatory and compliance lawyers and accountants.

But the Weidenbaum Center at Washington University in St. Louis and the Regulatory Studies Center at George Washington University in Washington, D.C., have put the regulatory compliance and administration cost in dollar terms. They jointly estimate it to be 11.6% of GDP as of 2011, and no doubt rising with complexity.

But how to put a cost on the whole ball of wax of regulation so as to clearly see the implications for lost growth? After all, it’s not possible to generate statistics on what didn’t happen. That is, it is effectively impossible to measure the opportunity cost of investments not undertaken, nor plants not built, nor inventions and potential jobs that fell by the wayside, except indirectly by the lost output capability of the U.S. economy.

On that there is one rough measure of the decline in the pre-Great Recession projections of the U.S. Potential GDP. The estimate of the frontier of possible output has shrunk and the supply side of GDP is projected to be growing at a slower rate than previously projected. This is a very rough measure of the shrinkage of the supply capability of the economy.

Other evidence of malaise reported by Lacy Hunt includes the fact that real median household income today is back to its 1995 level. Something is clearly amiss, and it’s not from a lack of mega-demand-side fiscal and monetary policy.

In a rare reflective moment regarding jobs not created and middle-income not produced, President Obama this past week conducted a series of hinterland college speeches in which he indicated that jobs and middle-class opportunity were missing from the American landscape and that we are suffering “unfairness” in income distribution. The opportunities are not there any longer for the middle class, he proclaimed.

Well how do you achieve fairness in income distribution except to redistribute from the top down? Rather than uttering income redistribution and being declared a socialist, he prefers “fairness” making himself a modern day populist in today’s discussion of the “isms.”

To be sure, there is a link between a lack of business development and middle-income jobs, but it runs from a lack of incentives or ability to navigate past regulations and taxes, obtaining financial resources and being unleashed to produce so that middle class jobs are forthcoming.

But in Obama’s world, the linkages run from middle class income to generate spending for companies to prosper. He explains this phenomenon as “leading with the middle class, an economy that grows from the middle out, not the top down.”

If this were physics, he would have gravity running upside down.

But it is welcome that after nearly 4 and a half years as President he is grappling with how to effectively produce jobs in America. Let’s hope he is a fast learner.

What I find interesting is that for the few one-off exceptions to promote an enterprise in order to keep jobs, the President provides subsidies, special tax breaks and a reduction in the paperwork that needed to be filled out (which to him seems but a minor irritant). Now the question is, can this selective perception be generalize to all endeavors?

It’s important since we have amply demonstrated that demand side policies have been applied beyond their useful limits, and supply side policy is all that is left. But what it requires is for the control freaks in Washington to let go. They must leave laissez-faire alone.

Since most lawyers who run for office are on a mission to do something to make a difference, laissez faire is not their inclination, and Obama has indicated that he will use executive orders that push the limits of Presidential power. For that reason, I’m not optimistic, as regulation is an adverse macroeconomic policy and income redistribution (under the guise of income “fairness”) eliminates income differences at lower levels of income for all.

It will probably take another farmer President like Jimmy Carter who toiled under the USDA to appreciate the virtues of laissez faire and allow it to thrive again.

Sign up to receive the Spellman Report. Bracing financial and economic insight. Now with free delivery!

Is the Printing Press Engaged for the Duration?

The Spellman Report

spell1A printing press is a handy thing to have. When a government or central bank can fund itself with money or claims on money, it can buy a lot of things and solve a host of problems, all without the need to tax. I wish I had one.
Developed world governments have lots of problems these days and hence are using the printing press overtime. And with lots of problems comes the thought, at least to an orderly mind, to somehow prioritize the buying. Or, if there is no order, than the disorder of whatever comes next is the order.

This Great Recession experience of the past five years has been an epic chapter of buying in the nearly 100-year history of the Federal Reserve.

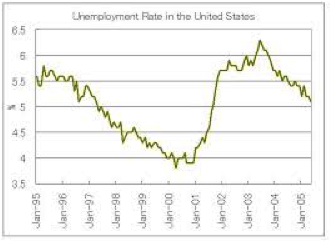
In the modern era, economy-wide sustainable growth has been the Fed’s guiding light. It worked quite well for some 50 years to temper the oscillations of the business cycle, both the highs and the lows. And the modern business cycles orthodoxy and Keynesian upbringing is causing the Fed to turn on the printing press to achieve an unemployment rate of 6.5% in this Great Recession, so they claim.

While defining success in terms of unemployment brings clarity as to what Fed policy is about, it opens up monetary policy to an unintended exit if factors other than economic recovery were to reduce unemployment. And financial markets in a bubble state as a result of the Fed’s buying fear that outcome.

As it happens, labor force dropout due to demographics or inadequate skills is occurring. Furthermore, work is being reorganized and parceled out so employees do not exceed 30 hours per week, lest their employers become subject to the Obama Health Care tax. All these factors are bringing down the unemployment rate more quickly than fundamental economic improvement.

Each month, there is a dread fear in financial markets that unemployment will decline sufficiently to cause the Fed to exit QE as they have pledged. Indeed it is the major risk to investors holding positions in an asset bubble market, whether it be in debt, equity, commodities or real estate.

spell2So as we approach the target unemployment rate without much economic recovery, the question is, can and will the target be redefined to be the unspoken necessity of supporting Treasury debt obligations?
The last time the priority of Fed buying switched from supporting banks and the economy to supporting the government effort to sell Treasury bonds was at the beginning of WWII.

In the three months following Pearl Harbor, given the expectations of the size of wartime debt issuance and with some inflation expectations thrown in, long Treasury yields ratcheted up.

The Fed then approached Treasury (not the other way around) indicating its willingness to enter an agreement to support Treasury bond prices at the March 1942 level for the “duration” of the war.

The Fed did this by buying enough Treasuries along the yield curve to prevent their prices from falling and the market yields from rising — a policy that became known as the Fed’s interest rate peg. It took a tripling of the Fed balance sheet in four years to do the job, which is roughly in the same league as the Fed balance sheet growth since the commencement of the Great Recession.

When the war concluded, federal government deficits turned into surpluses, and there was no longer pressure for the Fed to be the buyer of net new government debt. And furthermore, there was high inflation. This caused the Fed to claim the “duration” had arrived and that it was time to exit (there’s that word again). But there was a catch.

To Treasury Secretary John Snyder, exit in the name of economic stabilization was all academic heresy or a potentially expensive distraction from the core responsibility of a government to finance its debt at the most affordable rates. That is, he didn’t care for the idea that Treasury bonds would not be supported ad infinitum at par in the primary and secondary debt markets. Furthermore, he was backed by a gentleman in the White House by the name of President Harry S. Truman. Such is the core concern of a government as to the cost of its interest expense.

The Fed’s post-WWII exit attempt spilled over into widely followed Congressional hearings conducted by Senator Paul Douglas before the Joint Economic Committee. The core question was, did the Fed’s responsibility for full employment and controlling inflation trump the need for propping up the price of Treasuries so interest rates would not rise?

Despite Congressional support for the Fed to exit, it still took years until the Fed became determined to pursue a path independent of Treasury dictates, as inflation soared at the commencement of the Korean War.

While the brouhaha concerning exit continued from 1946 until 1951, an opportunity to back out of the Treasury bond support agreement occurred in 1951 (almost six years after the “duration”). At that time Treasury Secretary John Snyder was incapacitated and in the hospital and his next-in–line at the Treasury, William McChesney Martin, negotiated an exit agreement with the Fed at the White House with the President presiding. The agreement became known as the Accord and was the monumental turning point that allowed Fed independence to foster economic growth without inflation for the next half century.

However, there was a catch. The Accord set the Fed free to pursue economic stabilization so long as there continued to be a strong tilt to Treasury bond support. To accomplish that, Martin suggested, or perhaps insisted (as the folklore goes) that he be installed as Chairman of the Federal Reserve Board of Governors to represent Treasury’s interests in monetary policy — which required a resignation of the existing Fed Chairman. This was all accomplished before Snyder left the hospital. Such is the difficulty of Fed exit when the government’s ability to sell debt and service the interest expense is at stake. (For a revealing account of that history go here.)

What was most interesting about the 1951 exit is that after becoming Fed Chairman, Martin had a Beckett moment, or more like a Beckett career. In his almost 20 years as Fed Chairman he constantly tilted in the direction of containing inflation and would not peg Treasury rates below market even during the Vietnam War, which caused Lyndon Johnson to unsuccessfully seek his resignation.

In the context of today’s financing strains that will grow over the next four decades due to Boomer entitlements, consider the following: The U.S. gross debt-to-income ratio is in excess of 100%, and the CBO projects that ratio to reach 400% in the out years of entitlement growth. Hence, each hundred-basis-point increase in the average interest rate the U. S. pays to service its debt (above the present 2 percent average carrying cost) requires additional taxes to drain another percentage point from the income stream — a drain we can ill afford. You can do the math for the required tax drain when the debt-to-income ratio approaches 200% or 300% and if interest rates were allowed to reflect sovereign or inflation risk.

The CBO has estimated that in the out years of Boomer entitlements, tax revenues will need to be as much as 25% of annual income as compared to today’s 2% to merely service the projected interest expense on the debt, (even if market yields were to remain at average historical levels).

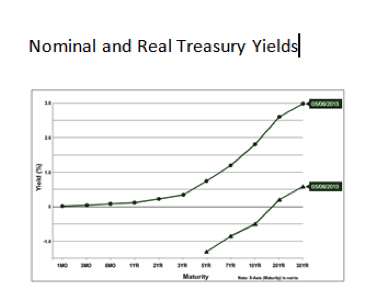
spell3Today there is a de facto peg already in place. It goes under the title of zero interest rate policy (ZIRP). It is also known as financial repression, which includes ZIRP along with positive inflation causing real yields to go negative all the way out to almost 20 year maturities and has become the explicit policy of the Japan and implicitly of Europe as well.

Given the perspective of the machinations at the end of WWII, is it reasonable to expect that Treasury (and the President and Congress) will allow the Fed to exit its already existing de facto peg? The new “duration” is the length of the entitlements.

Hence, the only likely exit for Fed QEs is an exit from the pretense that QE is an economic stabilization policy that can go away if unemployment hits the Fed’s target. It’s a cover story that is about to be uncovered. Fed buying is the supporting backbone of the Treasury bond market with $500 billion in annual purchases which, in turn, promotes foreign central bank currency wars. With the proceeds, they are investing as much as the Fed is in U. S. Treasuries.

Hence, current Treasury Secretary Jack Lew will have an important say as did John Snyder, in the selection of the next Fed Chairman (if he doesn’t wish to stand in himself). The change of guard will likely occur before the year’s end, when Bernanke returns to Princeton to write his account of the Great Recession.

Hence, what needs to be built is a graceful institutional transition for the Fed to exit stated economic stabilization priorities in favor of Treasury debt priorities without actually exiting its asset purchase program. Otherwise the Fed will morph from one pretense to another as they have done with a loss of their credibility.

So relax, bond market, interest rates will be pegged until inflation is no longer containable at the 2.5% level and that could well not stop them.


Sign up to receive the Spellman Report. Bracing financial and economic insight. Now with free delivery!

The Knockout Punch: Has America Turned to Socialism?

The Spellman Report

In the days following the election there was a numbing silence. It was as if the body politic was dazed by a heavyweight champion’s blow to the head. It staggered and sought clarity to understand what’s to become of our future. Even the 24/7 financial market / economic blogosphere went silent in contemplation.

What began to emerge from the cobwebs was a trickle of semi-coherent commentary of what was learned in the 1930s. Was it again a New Deal tilt toward socialism? References to past classicists such as Von Mises, Hayek, and H.L. Mencken were everywhere. Ayn Rand’s Atlas Shrugged sold more than 1.5 million copies since the first Obama election — a startling comeback for a 55-year-old work of fiction — and sales are again soaring. It has also spawned a series of film adaptations.

A realization set in that Obama’s victory in 2008 was not a one-off reaction to the George W. Bush presidency. Rather, it validated the notion that the U.S. was now a left-leaning democracy in the European style.

If there were any doubts, as the first order of business by Friday of election week, the president asserted that the election was a referendum revealing that Americans want taxes to increase for the wealthiest citizens but not anyone below the $250,000 income level. In his words, “Nobody — not Republicans, not Democrats — wants taxes to go up for folks making under $250,000,” he proclaimed. The definition of the bad guys has hardened.

While a very good case can be made for all taxpayers to pay more, apparently the imperative to redistribute income was more important than the goal of growing jobs and the economy or containing the fiscal deficits.

The question is whether the goal to redistribute and regulate is a shift in fundamental American values or merely a reflection of the president’s own agenda.

While a morphing of the American willingness to redistribute is a socialistic ideal, it is also possible that the redistribution reaction to events that began to unfold in the early 1980s and could even be nearing its end.

At that time, the globe was bifurcated into the developed world (the U.S., Europe and Japan) and a large number of countries that fell into the category of Less Developed Countries (LDCs). There were extreme differences in wages and income per capita.

With wages differing between the developed nations and the LDCs — in some cases with a ratio of 100 to 1 — producers naturally would gravitate to the ultra-low-wage countries. But there was a catch: Tariffs deterring “cheap” goods from entering the high wage countries needed to be dismantled.

At first, exports to the developed world proceeded in a trickle as producers sought cracks in the tariff structure, but such vast cost differences would lead to creative means of dismantling trade barriers.

The major break in protectionism of goods to high-wage countries came in the form of multi-country treaties to systemically eliminate trade barriers among countries.

NAFTA broke the ice and the post-WWII efforts to lower tariff barriers — the General Agreement on Tariffs and Trade — was replaced by the more effective World Trade Organization (WTO) with membership leading to a phasing out of trade barriers. Even Russia, the latest of more than 150 WTO participating nations, pledged to open trade and the momentum continues with a proposed U.S.-EU free trade agreement making headway.

As trade opened and production and jobs gravitated to the low-cost producers, new terminology was invented. Off-shoring and globalization meant that LDCs were “emerging” and then “developing.” All in all, Ross Perrot was right in his great debate with Al Gore. There would be a “Giant Sucking Sound” of jobs (and income) gravitating to the low-wage countries.

Of course, as the process of globalization unfolded, wages in the formerly ultra-low-wage countries have subsequently risen while those in the U.S. have declined, leading to a convergence of labor costs across countries. We are not at absolute convergence, but enough movement has occurred so that the U.S. is not as relatively expensive a place to produce any longer. While the exportation of jobs is not over, we are beginning to see the end of the tide going out and a trickle of the tide coming in (see: Made in America Again).

This is a process economists call Factor Price Equalization. That is, wages (the price of labor in all countries free to trade) eventually meet in some middle ground given the incentives to shift production to the cheapest source.

How does all of this relate to the election and socialism? The distribution of income in the U.S. got fatter in the two tails: those made poorer by being forced to get in line with the ultra-low-wages competition, and those with capital or skills that could not easily be duplicated abroad, which were made richer. The two tails in the income distribution end up fighting it out through their respective presidential candidates.

But globalism has also significantly eroded the middle class and shaped the election result.

According to an August 2012 Pew Research Center report, “half of American households are middle-income, down from 61 percent in the 1970s. In addition, median middle-class (real) income decreased by 5 percent in the last decade, while (middle class) total wealth dropped 28 percent. According to the Economic Policy Institute, households in the wealthiest 1 percent of the U.S. population now have 288 times the amount of wealth of the average middle-class American family” — making that a less-than-ideal group from which to select a presidential candidate.

The trends of globalization, wage convergence and the declining numbers and income of the middle class have been in process for almost the last 40 years, which is largely attributable to declining wage income. Moreover, wage income as a percent of total income has declined by about 10 percentage points. This was an enormous reduction in the labor’s share of the income pie and accounts for the middle class decline.

However, to compensate for this loss of income over the same period, transfer payments by governments as a share of the income pie has increased by 10 percentage points, as shown in the accompanying graph.

Since there is no free lunch, the transfers known today as entitlements needed to be financed somehow. The two logical options for addressing this issue were to tax and redistribute corporate profits or to redistribute from the president’s targeted group. Given the political stand-off in our body politic, the expeditious means to sooth the labor income shortfall was to borrow on the credit of the U.S. and subsidize via transfers or entitlements. As a result, the Census Bureau reported that 49 percent of American families receive at least one government benefit.

So here we are in 2012, and the ability to continue compensating for the loss of wage income by borrowing and transferring has hit up against funding limits due to baby boomer entitlements coming due. The cookie is crumbling, but the election indicates the middle class still wants its cookie — and the ability to borrow someone else’s cookie and pass it around has reached an un-financeable end. We have three choices: take a cookie from “rich folks” and pass it around, grow the number of cookies, or realize there will be fewer cookies. The redistribution argument won at the ballot box.

Personally, I don’t see Obama’s reelection as an enthusiastic validation of a socialistic ideal but rather a vote to sustain labor’s income share — but functionally it makes no difference.

As Forbes contributor Bill Frezza summarized it: “America has now hurtled past the dependency tipping point … and an electoral majority happily voted for itself unlimited benefits that will supposedly be paid for by a productive minority — until that productive minority starts eyeing the exits.”

Since blatant redistribution squashes incentives to produce and grow, the incentive to redistribute also grows. Once headed down that slippery slope, it takes dire circumstance, not a threat of dire circumstances, to cause a rethinking and a redirection back to free market capitalism.

China went all the way down the slippery slope. With economic misery as a result, in the late 1970s Deng Xiaoping asked the question of how to provide more food as its state-owned farms didn’t adequately feed the population (despite 82 percent of the population working in agriculture). The “reform” was to allow state farms to sell and retain the proceeds of its agriculture production in excess of its socialistic quota. Look what incentives did for China. She has never looked back and likely is now more capitalistic than the U.S.

In the election, Obama prevailed despite receiving 10 million fewer votes than he received in 2008. This was no apparent landslide for socialism. But the outcome was also a result of a Republican dialog that failed to demonstrate how making cookies includes a reward for the wage-earning middle class.

Both the message and the messenger were off key, and as a result we could be headed down that same slippery slope that might not be reversed until there are not enough cookies to go around. It could be generations before “reform,” such as in China, prompts us to reconsider entrepreneurs and the fruits of entrepreneurship. At that time, they would once again be considered heroes rather than villains but that could be far down the road.

If you enjoy this blog, please forward it to others who may be interested. Sign up to receive the Spellman Report. Bracing financial and economic insight. Now with free delivery!
[send-link-to-friend]

What does Thomas Edison have to do with bonds and gold?

The Spellman Report

In these times of economic upheaval, divergent opinions regarding future inflation exist side by side: Either Grand-scale inflation or deflation, take your pick. The differences are actually not side by side but at either tail of a subjective probably distribution of inflation expectations. This is economic jargon for the simple idea that there two opposing stories being told as to how future inflation will play out.

This cleavage in expectations exists not just among economists, but opinions also divide Fed policymakers and financial market participants alike who simultaneously assign, for example, very high prices to both fixed income debt that benefits from deflation and inflation-adjusting debt (a la the Treasury TIPs) that benefits from inflation.

There was a time in my life when I was involved in the development of inflation adjusting financial products that ultimately earned a U. S. patent. In what was an education in investor behavior, I was surprised to find both buyers and sellers projecting 30 years of future inflation solely based on the last monthly CPI report extrapolated forward for 30 year. So today’s bimodal inflation expectations are a notable exception to the usual normal distribution of expectations squarely centered on the most recent past.

So what is at the heart of the cleavage in inflation expectation? Obviously, there are two visions of the eventual outcome of the financial crisis and the Great Recession whose repercussions continues to morph and plague the economy. It has resulted in extremism in government financial needs and monetary policies never before seen in the developed world to contain the recession and aid and abet the refinancing of consumer debt and the financing of government deficits.

But also on the minds of inflation watchers is the implication of the baby boomer entitlement boom which is now booming. For example, the Social Security Trust Fund, the only entitlement with a trust fund of any significance, is expected to be depleted in only 3 years. Thereafter the financing of the boomer entitlement packages will create leaps in government financing stains and further central bank co-opting to make an inflation outlier possible.

Whatever the historical model or the free floating paranoia cited by the Grand-scale inflationist, it all follows from the pressure on governments to raise funds by selling bonds either to support the economy or support the entitlements and for their central banks in turn to purchase a large portion of that debt as central banks do with printing money. That is made necessary because private saving both domestic and/or foreign are insufficient to finance the government’s debt lust. To most Grand-scalars the process comes down to the single catchword: “printing.”

Since much ink has been devoted to Grand-scale inflationist arguments, likely as much ink as needed to print their feared currency explosion and I won’t add to it here but rather review the deflationist’s positions which are less well known and are subject to recent qualifications.

The deflationist views are almost as radical a departure from our historical norms at least among the living. Deflation is associated with depression which to the deflationists arises from the idea that servicing both the consumer debt load and the government debt load, both present and future, will deplete income streams leaving very soft goods markets demand and hence soft pricing.

Other deflationists point to the possibility of a sovereign default which is not likely with the printing press within reach of our government. If it were to be a sovereign default generated deflation it would likely be delivered as the result of contagion from a depressed European default.

But deflationists still find falling prices a likely outcome even without a default as a result of the fiscal restraint to prevent one. That is, the upcoming fiscal cliff is not seen as a one-off exception but as the forerunner of generalized austerity for a long time to come that will be sufficient to soften demand in goods markets so as not to put upward pressure on goods prices, despite the “printing” they observe.

So to today’s highly influential deflationists and bond devotees, the soft demand creates excess supply in goods markets is seen as an insulation from inflation if not the driver of absolute deflation. In this case, the asset of choice is fixed income, the longer the maturity the better, general stated as a strategy of safety and income at a reasonable price (SIRP) championed by David Rosenberg and other very notable financial economists.

The supply insulation from inflation is measured by the excess productive capability relative to aggregate demand and is shown in the accompanying graph as the difference between Potential GDP (the supply side) and Actual GDP (the demand side) for the past dozen years. When the Great Recession arrived, the demand side (Actual GDP) plummeted well below Potential creating what is known as a deflationary gap. Deflationary gaps have been seen before but never of this magnitude in the post WWII period.

What could eliminate the inflation safety margin would be successful government attempts to spur Actual GDP upward and onward to approach the path of Potential GDP. However, the massive fiscal and monetary stimulus during the Great Recession years has only put an end to the GDP free fall and thereafter GDP demand has only been able to track below and in parallel with Potential GDP target leaving what appears to be a substantial margin of inflation insurance.

But alas, the deflationary gap comfort margin for fixed income also depends on the growth path of Potential GDP. The estimates of Potential supply are made by the Congressional Budget Office from projections of increases in capital (plant and equipment), the labor force and the productivity of the combined labor and capital inputs. For much of the post WWII era we lived in the heady bubble of steady state growth with relatively minor and short recessions which made steady state, trend extrapolation easy and more reliable.

But, we are now finding that without the pressure of demand growth, a lot of things change including the incentives to add new plant capacity when excess capacity exists and labor is cheap. An additional slowdown of Potential occurs as new plant and equipment generally embodies the latest technology and makes a productivity contribution to Potential as well. That is, the engine of Potential Supply runs through the Thomas Edisons in the laboratory, to venture start-ups and through the IPO process but it has downshifted and reduced not just the level of Potential GDP but its growth rate as well.

As a result, at year end 2011 the deflationary gap would have been a very large 11.3% of GDP had the estimated Potential Supply growth made at the onset of the Great Recession been realized. However about half of the inflation insurance provided by the deflationary gap has disappeared based on the 2011 Potential GDP revision, leaving a deflationary Gap of 5.6%. If one were to examine the graph and extrapolate both Actual and Potential GDP it would not be many years before they cross.

Further concerns for the supply side exists when we find that when Plant and Equipment spending slows down, its average age is getting older hence both labor and capital should be comforting each other as they grow old together.

Moreover the general negative view of the outlook for productivity growth has been expressed by Robert Gordon the well-known productivity expert and is well summarized by Martin Wolf in “Is Unlimited Growth a Thing of the Past?”

While the Deflationary Gap is still substantial, we can see where things appear to be headed. The logic is clear: Necessity is the mother of invention, and without pressure to produce more, there is little sense in building a capital stock that imbeds productivity gains. This idea is consistent with recent data revisions.

With an economy that is trapped into long term sluggishness and consolidation on the demand side from fiscal austerity pressures, it will also slow the Potential Supply side. This means it takes a lot less growth on the demand side to generate inflation. And add to that the commodity supply shortfalls which keep upward pressure on food, energy and raw materials prices.

Indeed, even with a Great Recession when, other than in the cascading shrinkage of 2009, deflation has not been forthcoming as suggested by theory.

While the Tomas Edisons of the world are still out there tinkering, fewer of the fruits of their research are benefitting productivity. The implication is more inflationary sensitivity than one would expect from a relatively slow growth economy which provides comfort to the value of the investment categories favored by the Grand-scalers such as gold and real assets.


If you enjoy this blog, please forward it to others who may be interested. Sign up to receive the Spellman Report. Bracing financial and economic insight. Now with free delivery!

Milton Friedman and the Monetarist Reflex: Can the Fed create inflation?

The Spellman Report

These are complicated times, especially when it comes to inflation.

An excess of debt, both private and public, has retarded the spending stream, resulting in sluggish economic growth. Given the Fed’s legislated commitment to prevent financial implosion and unemployment, rounds of central bank monetary responses have followed. The intuition of more money in our pockets chasing a limited supply of goods, as well as our long intellectual history of monetarism, sets off the reflex that printing results in inflation. That hasn’t appreciably happened yet, but multiple rounds of QE keep markets on edge given the teaching of Milton Friedman,

To add to the inflation paradox, last January, for the first time, the Fed committed to producing moderate inflation (2 percent) “over the long run“. However, as recently reported by David Rosenberg, inflation at the producer level was flat over the last quarter, and given the Euro recession and continued U.S. sluggishness, it appears likely that the inflation goal might not be reached. Indeed, many credible sources are forecasting long-run deflation, a la the trend in Japan.

On top of that there is the conjecture, mentioned in a recent post that in the (likely) event of an uncontrolled government deficit, the role of the central bank would be to generate actual inflation that exceeds the expected inflation premium that had been priced into interest rates. The purpose would be to reduce the real cost of government debt. This seems to suggest that the long-term Fed inflation target is to keep expectations anchored at a number the Fed hopes to exceed.

But in the longer run, while accumulating four decades of baby boomer entitlement debt, it would take one surprise after another to exceed expected and priced inflation. And each would have to be larger than the last to continuously have actual inflation exceed that which is priced by the market. This is the implied path to what is journalistically called “runaway inflation.”

The Fed inflation targeting in the long run is one thing, but the real question is whether the Fed can deliver when it so far has not.

The paradox of strong growth in the monetary base without the inflation implied by monetarism first surfaced when the first Federal Reserve balance sheet leap occurred in 2008. At the time, many people believed that a doubling of central bank money chasing a short term fixed supply of goods would bring about a doubling of the price level.

Obviously, that didn’t happen. The question is why not.

First off, at that time, the commercial banking system did not have the requisite regulatory solvency (an excess of asset values relative to deposits) to expand balance sheets if they had the risk tolerance. That is, today’s excess cash reserves of $1.5 trillion held by banks and a commercial bank money supply multiplier of say 10 would normally result in $15 trillion of lending and spending. A surge in bank-financed spending could roughly double the present $15 trillion annual flow rate of GDP and, with it, inflation.

The predicted proportionality of prices to money didn’t occur, as spending not only failed to increase appreciably with more central bank base money, but fell short of the economy’s supply potential so that deflationary forces from excess capacity still exist today. (This same phenomena to monetarists would be the explanation for the decline in the velocity of money.)

So the issue of inflation depends to a large extent on the ability and willingness of commercial banks to run with the base money given to them. The most recent reading of that is not encouraging to either the growth of spending or inflation, as the graph above shows.

Despite having been given a stealth capital buildup via an essential zero cost of funding program (in addition to the TARP subsidy), the commercial bank books claim solvency, but lending contracted in the first quarter. The Keynesian notion of the liquidity trap is still alive and festering with banks pointing to a lack of borrowers and borrowers pointing to a lack of willing lenders. The problem, more than loan risk analytics, is likely behavioral. As aptly discussed by Kevin Flynn:

“For the last 50 years banks have been behaving the same way — turning a profitable sector into a credit fad and then drowning it in the name of market share, management bonuses, takeover avoidance, or whatever. Once they blow a sector up, nobody wants to hear about lending to it again for another generation of CEO management, which runs for about five to 10 years (the last thing that managers brought in to replace disgraced managers want to do is more of what got their predecessors sacked). Banks finally got around to blowing up housing, so now we have a generation of bank executives in place whose unifying feature is the determination to avoid a housing bust that won’t happen again for another 70 years or so. The Fed can’t do anything about it.”

Given these impediments to produce monetary expansion and lending through banks, there are other routes by which the Fed might reach its inflation objective. Without bank follow-through, the impact of monetary expansion is limited to the Fed’s first round of financial purchasing power. This limitation of its firepower is what turned the Fed to large scale QEs, since there would be no commercial bank follow–through: They had to do the job themselves. But since the Fed is not a commercial lender, it mainly relies on what is known as a Pigou effect — a generalized market value of wealth spreading from bonds to equities and other assets that in turn induces limited spending but not at a rate sufficient to create inflation.

Another approach to inflation (which the Fed scoffs at) is un-lovingly called helicopter money. This was the first thing done when the financial meltdown occurred, in the form of the Fed putting money more directly into the hands of spenders (as opposed to financial asset markets). That is, rather than just continuing more of the same Fed expansion, helicopter money delivers fresh spending power directly to the end user (the consumer) over the heads of the moribund banks.

Believe it or not, this was implemented in the dark days of 2008, when the Fed purchased Treasury bonds that enabled the Treasury department to mail out an equal amount of government green checks directly to spenders. It flew under the radar screen as the checks were called tax rebates, and few knew the source of the funding. However, a wider distribution of government green checks coming from the Fed or the Treasury would require a more obvious money gift that would create contentious comparisons of need. To further rule out more green checks to consumers (especially voters), the Republican Party platform is now at odds with at grossly expansionary Fed tendencies, and the Fed is not likely to expose itself to legislative constrains to its independence.

If the government wishes to depreciate its debt and consumer debt with inflation, a more likely inflation alternative would be for the Treasury Department to turn to treasury currency, the United States Note. As previously explained, the government used this tactic to pay its bills during the Civil War.

In this case, the financing of government spending is facilitated by Treasury currency printing rather than Federal Reserve printing. Treasury currency would have a greater inflationary impact as it directly finances spending in goods markets. In this case, inflation would be a fiscal byproduct rather than a central bank contrivance.

Treasury currency would be more effective as it goes over the heads of the blocked banking system and reluctant spending units, and on behalf of the taxpayers, goes directly into the spending stream when the government pays for entitlements such as Medicare. As such it is a kind of super-helicopter money delivered to the goods markets rather than the financial markets or even to the consumer to be used for debt reduction as the new currency is injected into the spending and income stream.

When political leaders are pressed to “do something,” it seems that this would be the “something” that could simultaneously finance entitlement spending, reduce the size of the fiscal cliff, and reach a desired inflation target. This is a something for nothing policy solution that politicians who take the path of least resistance would find difficult to ignore-and it’s in the law.

What an irony. Despite the accusations being made, the Fed in these circumstances is only able to produce inflation expectations whereas Fed generated inflation is dependent upon a generational replacement of commercial bankers.

It seems the notion of an inflationary future one way or another is still alive and ticking. Recently, inflation adjusting assets including energy pipelines, gold, income producing real estate and infrastructure are now moving up in the markets and fixed income assets are moving downward. Though the Fed has struck out on the inflation front, the bet has switched at least at the margin to the government doing “something” in the long run to ultimately reach an inflation target. Keep tuned to see how these improbable policies and events work out.

If you enjoy this blog, please forward it to others who may be interested. Sign up to receive the Spellman Report. Bracing financial and economic insight. Now with free delivery!


Sign up to receive the Spellman Report.
Bracing financial and economic insight.
Now with free delivery!

The Bond Market Rocket and Fiscal Unsustainability Are On a Collision Path

The Spellman Report

Recently, the bond market has been in rocket mode. It has achieved liftoff and slipped the surly bonds of earth. And some believe it will keep going. The price of the U.S. Treasury 10-year bond recently reached an all-time high, generating yields at all-time lows. Moreover, the market yield on the British perpetual bond is reportedly at a 300-year low. Bond mania has even spread to the sovereign debt of Denmark and Singapore and others where negative yields exist. More astonishing is the ability of France to issue short-term sovereigns with negative yields!

The U.S. has eclipsed the record interest rates that prevailed when the 1930s Depression era came to an end with the onset of World War II, as shown in the chart to the right.

To get to the previous low yields of early December 1941, the U.S. economy had experienced a decade of depression with cumulative deflation of 30 percent. With that decade-long trend influencing expectations, the future seemed to call for more of the same. In that environment, investors favor long-term fixed income that appreciates in real terms as a result of deflation if the long bond is successfully paid and retired despite depression circumstances. Hence the asset category of choice in a deflationary depression is survivable high quality debt. In the ’30s, this also included surviving corporate debt that appreciated along with Treasuries, and the AAA-Treasury spread narrowed over the depression years.

Since we presently are in an era of Federal Reserve QEs, you might suspect that the Fed was possibly behind the rising Treasury prices and lowest yields of that era. However logical it might seem in today’s context, the Fed was nowhere to be found on the buy side of the Treasury market during the depression (something Bernanke seeks to not repeat). Indeed, the money supply declined by 30 percent over the course of the depression, so the bond market did it all on its own, without Fed support. Indeed, being in a pre-Keynesian world, the rationale or desire for manipulating the interest rate or credit conditions was not part of the Fed’s understanding of how to run a central bank.

Then as now, the private market participants price the expected risks and costs of holding a debt instrument over its life, and they require additional yield for each risk and cost they anticipate will materialize. They generally make this assessment of risk by extrapolating previous trends or by finding a similar historical episode to benchmark the likely gains or losses in value that might take place. Today we find many forecasts (even on this blog) citing the withering force of deleveraging due to over–indebtedness, which takes down an economy and softens demand and prices for goods. Hence, today’s natural historical model for bond pricing would seem to be the 1930s.

However, while there are similarities, there are also big differences. Today it is the government that is over–leveraged, whereas in the l930s it was the corporate debt sector which makes today’s long Treasury yields suspect. Though the economy is weak today, we are not in a decade-long depression, and while inflation is low, it is not in a cumulative deflation. And while the Fed held back this week, they still have a commitment to positive inflation.

The greatest difference is today’s checkmated body politic, which is unable to resolve an ultimately un-financeable Federal deficit. This week we had another episode of kicking the can down the road, with the agreement to run the debt meter another six months before facing the music. This is all in sharp contrast to a much lower government debt load and an obsession to run a balanced fiscal budget despite the depression that prevailed in the 30s.

While the growth/inflation profile is different in the two eras, it is more important to note the difference in long-term fiscal sustainability. Somewhere during the unfolding drama there will be an unspoken need (not mentioned in legislation or treaties) for the Fed to pull a “Super Mario” Draghi — who, last week, signed up to “do whatever it takes,” which apparently meant ignoring the ECB mandate and directly supporting Spain’s bank and government debt because the market no longer will.

Indeed, in the U. S. at the outset of WWII, the Fed presented the patriotic idea of wartime bond support to the Treasury, not the other way around. Central banks are not shy in the ultimate moment of money needs.

In what should be considered a “white paper,” the Fed’s role in these dire circumstances is recently discussed by Renee Haltom and John A. Weinberg in the Richmond Fed Annual Report, 2011, titled Unsustainable Fiscal Policy: Implications for Monetary Policy. In a rare Fed admission they indicate that “a central bank can reduce the government’s debt burden by creating inflation that was not anticipated by financial markets. Inflation allows all borrowers, the government included, to repay loans issued in nominal terms with cheaper dollars than the ones they borrowed.”

Indeed, if the Fed were to create inflation, it would not be totally unanticipated. This is the outcome seen by many observers, including Bill Gross of PIMCO.

And Bill Gross is not alone, as the bond-buying public seems to believe little of the fiscal sustainability story. Indeed, the flow of funds data, at least for 2011, indicates that the private sector purchased a minority of net new government debt issuance. Hence, private investors are not the leading purchasers of U.S. Treasuries, causing the all-time depressed bond yields. The graph indicates that the Federal Reserve is buying the lion’s share of net new Federal debt, and foreign investors are in second place. That market thrust no doubt represents a flight from European sovereign exposure, which is in a more advanced state of fiscal decay at the moment.

No doubt some have bought the1930s deflationary depression story as a model outcome to justify buying and holding sovereigns, but this time around it doesn’t lead to the necessary conclusion that sovereigns will appreciate from here. At today’s entry point of taxable low nominal yields and negative real yields, betting on both a deflationary depression with fiscal sustainability is not only a long shot but is mutually inconsistent.

A deflationary depression doesn’t generate government tax revenues to reach fiscal sustainability unless the voting public is willing to accept a substantial entitlement haircut. Moreover, if the low bond yields were to be maintained it would systemically cause defined-benefit pension plans to underperform. They would become forced sellers of sovereign bond holding to meet payouts — as is now finally occurring with Japan’s Government Pension Investment Fund.

The bond market rocket can glide for a time, perhaps years, until it collides with fiscal unsustainability. At that time it will be revealed plain enough for all to see when the private demand evaporates, much as it did with Spain this week. At that time, the U.S. Treasury is no longer a riskless debt instrument, nor is it immune from inflation.

(That being said, it leaves open the question of whether intentional inflation is bravado in the absence of bank lending, which will be addressed in a subsequent blog.)

When the market comes to understand that sovereign bond strength from a central bank is a mixed blessing — as it both purchases government bonds but also intentionally seeks to create “unanticipated” inflation —the bond market rocket is susceptible to the gravitational pull of Earth.

When that happens, there will be a large debris field for those who entered this untenable crowded trade (or stuck with it) so late in the game, supported not by the bond-buying public but only by a central bank wishing to do its patriotic duty — which includes inflation generation.

This indeed is not the 1930s.


If you enjoy this blog, please forward it to others who may be interested. Links to forward and sign up to receive are in the right hand column.

Liquidity and Asset Bubbles, But Only if the Dam Holds

The Spellman Report

In a December report, the Organization for Economic Co-operation and Development noted that its member governments “are facing unprecedented

challenges in the markets for government securities as a result of continued strong borrowing amid a highly uncertain environment with growing concerns about the pace of recovery, surging borrowing costs, sovereign risk and contagion pressures.” The report projects that industrialized governments’ gross borrowing needs will exceed $10 trillion next year, and government deficits are estimated to be 6.6% of the income bases of those countries. Private saving is not likely to cover the growth of debt. This leaves a funding scarcity for plant and equipment as well as sustained economic growth — meaning you can finance governments or economic growth, but not both.

While those are the raw numbers of both rollover and additional bonds to be absorbed, the report fails to point out all the incentives for private parties to divest themselves of the same securities. The incentives to get out of the bond pool include: bank deleveraging (which results in the selling of government securities); the pending rating downgrades of Euro sovereigns and the questionable value of financial insurance on the Euro sovereign bonds due to counterpart risk.

If, these are not ample reasons for investor concern; there is more. The list should also include the risk of a devaluating Euro if capital flight occurs; or if a country were to pull out of the Euro zone, euro claims would then be denominated in some new home country currency that is bound to fall in value. If that is not enough to cause one to pause before investing in the $10 trillion to be offered this year, there is a possibility of a preemptive Euro zone sovereign default, and countries do not hand over their hard assets to a bankruptcy trustee to be distributed to bond holders as with a private bankruptcy.

Aside from these incentives to NOT be swimming in the government securities pool, China’s declining trade balance surplus will reduce its accumulation of developed-world government bonds. So the doctrine of “spend now and send to the bill to China” is grinding to a halt just when it is really needed.

Euro governments were expected to address this shakiness in government bonds at the recent summit by agreeing to put themselves on a debt budget. However, when push came to shove, the summit revealed that the combined governments of the EU were unable to strengthen the fiscal responsibility provisions of the Maastricht Treaty. They settled on each individual country legislating debt controls. Since we have already seen the U.K. say, “Yes, BUT …” to fiscal responsibility, the precedent has been set for each country in turn to say, “Yes, BUT …” to protect their own sacred cows. So much for solidarity.

The summit also revealed that even in a crisis Germany would not spread its own fiscal largess to the common protection of other governments’ debt. Germany’s demur, while consistent with its genealogy, was no doubt influenced by the shock of a failed auction of German Bunds over Thanksgiving.

So where are we on the greatest fiscal weakness and threatened financial collapse since the Great Depression? There are no fiscal resources, no hidden piggybanks of stored-up reserves for a rainy day. Government rescues of other governments or their banks would need to be debt financed, which is the problem and hardly a solution. Hence, we are left with the one big option of monetization. Think of this as market support based solely on liquidity rather than solvency.

While direct monetization of Euro sovereigns is taking place at the rate of $20 billion per week (more than $1 trillion per year), most of the government bond support under the Euro treaty would need to be accomplished in an indirect way. Since the treaty inhibits the ECB from doing a Quantitative Ease and purchasing a large stated block of government debt, its support of sovereigns is via “unlimited” super-cheap three-year loans to banks, which can use the full face value of the government bonds as collateral. Think of the leverage, the incentives and the profitability for the banks. Purchase an underwater Greek bond in the secondary market, say at half of face and borrow the full face of the bond and profit from the wildly high spreads.

This two to one loan-to-value ratio is a carry trade that even hedge funds can be very envious of. In the first day of this new lending program, the banks borrowed $635 billion. For the ECB as the lender, this was a balance sheet expansion that exceeded the Fed’s nine month QE2. However in the logic of no free lunch, the loan program supports bank solvency and in turn government bond prices which are the most immediate problems, but it shifts the financial system’s insolvency from commercial banks to the central bank and raises the question of will the market flee the Euro when this becomes understood.

While this is material support that can and has gone a long way to relieving Euro bank liquidity problems in the last two weeks, it still does not generate enough comfort for non-bank private wealth to continue funding the government bonds with its own capital rather than ECB easy money loans. Private wealth owners are still left unsure of whether the central bank government bond “put option” (willingness to support the price) will be in place.

To the private investors in Euro sovereign debt, the central banks being the buyer of last resort is not a strong enough commitment. They care more about financial protection of their asset. They want the central bank to establish a floor price, not just to protect their investment but also to insure that the borrowing government’s cost of money does not rise above the threshold of fiscal survivability. This means that central banks more than ever are in the financial price-fixing business to keep the non-bank private investors swimming in the pool of sovereign indebtedness. Setting the minimum price is better known as an interest rate “peg,” which is far better financial insurance than a CDS contract. It is financial insurance that investors do not need to pay for, and the central bank is a better counter party than some unidentified AIG in the making on the other end of a CDS contract.

This reminds one of the Fed’s great interest rate peg of WWII. Scarcely 90 days into the war, the Fed, seeing the slippage in government bond prices due to the market’s anticipation of being flooded with Treasuries to finance the war, stepped in to announce the Accord. This agreement in effect provided investors with a put option to protect the price of Treasuries for the long haul — defined simply as “the duration” (which lasted nine years). This encouraged the private buying of Treasuries in addition to the Fed’s buying.

The same is being asked of the ECB for the same purpose today. The ECB has implied it will do the same, but it can only offer hints, as the Treaty does not condone it. Critics say there is a lack of clarity in the ECB’s put option or price support that hinders Europe’s sovereign funding. This is true: third-party guaranteed debt is better than holding the paper without a guarantee. Moreover, it is in the interest of the ECB to provide financial guarantees as any private funding shortfall of government debt must be covered by the ECB’s own balance sheet.

This raises a key issue: What are the market implications from a central bank interest rate peg? What is being described, for as long as it holds, is an asset bubble centered in the first instance on government debt. It’s not the garden-variety asset bubble of tulip mania or more recently of housing mania that gave rise to behavioral finance ideas of confidence in ever-rising values, but an ongoing departure of sovereigns pricing from some underwriting standards of fundamental value that one can read from an Excel spreadsheet. It’s not irrational exuberance or excessive speculation, but it’s an asset bubble nonetheless. The question is, what other asset prices are affected, and in what direction and for how long?

To the extent that market yields are held lower than what the market would price on its own for a long period of time, and U.S. Treasury yields are indeed at all-time lows, these induced lower yields spill over to a generalized asset pricing bubble for assets associated with income streams. This is because a lower discounting rate of income streams makes the streams more valuable, so the distortion to fundamental value carries over to other asset classes as well. This is a reasonable interpretation of the price buoyancy of dividend-paying common stocks, preferred stock, apartment REITS, farmland, high-quality U.S. debt, pipelines, utilities, etc. And don’t forget the ramping up of the carry trade for similar assets when many central banks are aggressively pursuing expansion whether or not they are specifically targeting ZIRP (zero interest rate policy).

But which income streams will be most affected: fixed income or income streams with some upward inflationary response? If you believe that containing Euro fiscal deficits and deleveraging of finance will produce deflation, then high-quality fixed income is inflated by the bubble. If you think that the central bank’s spending power will ultimately generate inflation, then incomes producing real assets become most favored. With likely bimodal distribution of expectations on inflation/deflation, there are camps that support both.

As long as the government bond dam holds to keep liquidity in the Euro government bond market, those assets classes stand to benefit — but the bigger issue is, how long can the dam hold? When the market wants out of Euro sovereigns, the liquidity that seeps out must be replaced by the central banks. That means the rate of expansion of the central bank’s balance sheet now accelerates to cover both a fraction of the new issuance of government bonds, but also the quantities of government bonds the private market is casting aside.

It is possible that emulating the Fed’s 1940s successful sovereign price support (pegging of interest rates) could give Euro governments years of financing survivability as it did for the U. S. and some hope that growth will kick in — but there are too many ways the dam can be overrun, despite all the bank incentives and government promises. In the meantime, it’s an ultimate test of whether debt prices can be maintained with liquidity alone, irrespective of the solvency of the underlying bonds. That is, can liquidity trump insolvency?


Receive The Spellman Report Monthly for Bracing Economic and Financial Insight


Click to Subscribe Now

Follow The Spellman Report

Click to Email Dr. Spellman
Tweets by spellmanreport
Lew Spellman

Lew Spellman is Professor of Finance at the University of Texas McCombs School of Business. The Spellman Report seeks to interpret current and future trends in the economy and financial markets from the perspective of history, theory and policy.

Other Commentary

Frank Beck, Beck Capital Management
Bill Gross, Janus
The Grumpy Economist
Jeffrey Snider, Real Clear Markets
Ben Bernanke
Hoisington Management, Economic Overview

RECENT POSTS

  • The Goose that Laid the Golden Egg and Nobody Wants It
  • Is it Risk or Uncertainty?
  • The Recovery from the Great Recession is over. What Happens Next?
  • The Anniversary Blues
  • The Trump Tariff Offensive
  • The Inflation Divide
  • The Debt Boomerang
  • At the Cross Roads of Money and Inflation
  • The Bitcoin Mania
  • Déjà Vu All Over Again: Today’s Suspicious Looking Stock Market

POSTS BY TOPIC

Disclaimer: The Spellman Report is not an offering for any investment. It represents only the conclusions and analysis of Professor Lewis Spellman. Any views expressed are provided for information purposes only and should not be construed in any way as an offer, an endorsement, or inducement to invest.
© 2018 The Spellman Report
↑