↓
 

The Spellman Report

The Spellman Report, Where the Economy and Markets Meet

The Spellman Report
  • About
  • Blog
  • News and Views
  • Video
  • Investment Management
  • Speaking Engagements

Search Results for: "financial market trends"

Will 2009 Financial Market Trends Hold Up in 2010?

The Spellman Report

2009 Financial Market Trends

In the last month of 2009 some of the financial trends of the year seemed to veer off course. While trend reversal in December is not unexpected as money managers seek to realize and book audacious total returns to give them bragging rights for their 2009 performance, however, the recent retreat on a number of fronts raises the question of whether the underlying expectations that drove asset performance in 2009 are changing. If that is the case expect 2010 to be different.

The year was dominated by the rush into US and emerging country risk assets along side of a rush out of the US Dollar and into commodities and commodity currency investments. What seems clear is there were three major expectations (not likely by the same group of investors) that moved financial markets and total returns in 2009. First, the US economy would spring back, otherwise known as the “V” recovery, which drove US risk assets, both debt and equity, upwards. The second expectation being priced was the idea that emerging markets (EMs) and especially China among the EMs would grow and prosper even if the US and the developed world might not, again pushing upward both debt and equity in those countries.

A third expectation that moved some investors is the realization that the US is in a very deep fiscal hole that we keep digging ever deeper as there is no politically feasible exits from entitlement program spending. The forward looking US fiscal deficit produces genuine fears of an ultimate US Treasury default when the market becomes unwilling to roll over Treasuries in which case it is presumed that the US Dollar printing press would be employed to make good on US obligations. Hence US sovereign risk and inflation risk is the flip side of the same coin that produced strong movements away from the US Dollar and into commodity hedges especially gold and commodity currency investments.

The not unrealistic expectation of the long term US fiscal malaise provided the spark behind the broad based desire to be out-of-the US Dollar which resulted in a decline of 15% in the US Dollar at its peak in 2009 (despite Dollar support by some of the EMs), a rush into commodities despite the weak end use of commodities, especially oil, and a desire to reallocate capital from the US to the EMs. This US fiscal/inflation related risk also tended to produce a steep yield curve and a preference for TIPs over long term fixed rate debt.

The 2009 asset class performance was also influenced by the basic economics of the Carry Trade which was funded by almost costless leverage available in the US Repo market. With cheap short term credit available in the US which in turn funded leveraged acquisitions of fixed income in other lands in order to gain spread income helped push along the uptrend in risk assets generally but especially in the EMs and pushed down the US Dollar as funds borrowed in the US were invested offshore.

Credit Problems Abroad and a Flight Back to the Dollar?

The basis for possibly believing that asset class performance will be different in 2010 comes from new developments as the economic crisis/recovery morphs along. The first challenge to the V recovery is the realization that the Fed is under pressure to produce the “exit” from financial markets that it has promised and the economic recovery (x-government steroids) is still weak despite continued fiscal and monetary injections. Though the US growth picture will perk up this quarter due to a strong inventory build-up for Christmas, but it is far from clear that a deleveraging consumer without a commercial bank capacity and willingness to lend will actually produce a V recovery equal to that which has been priced in and additionally we face the prospects of growth killing tax increases to help control the US fiscal deficit.

Another challenge to the market pricing of the V recovery comes from skeptics who see economic malaise in 2010 and forward years based on renewed loan losses from commercial real estate and private equity loans that can’t be totally covered up with accounting obfuscation and de facto suspension of bank closure. The double dip expectation was no doubt stimulated by the Dubai state run real estate empire defaults. So as we near the end of 2009, current developments are curiously reinforcing both the V and the W enthusiasts. Though both can’t be right simultaneously, the expectations can simultaneously be held by different groups of investors at the same time and move different assets classes consistent with this mutually exclusive thinking. In this case an actual double dip recession or W recovery would cause related risk assets such as commercial mortgage securities to weaken as well as the banks that are holding them.

Another important change that is taking place is the rebound in the US Dollar What might be causing the US Dollar rebound is NOT a change in the long term US fiscal threat except for the resistance to further fiscal red ink now taking hold in Congress but a new event has highlighted the possibility that while our LONG term fiscal problems are dire, there are other countries with even more dire SHORT term problems that will cause funds to flow back into the Dollar and from there into the Treasury market as the RELATIVELY safe haven for wealth at least for now — much as occurred in 2008.

Specifically the UK and a variety of Euro zone country debt is now under the market microscope. These European countries for which fiscal deficits are more out of control than the US, their sovereign debt has been downgraded or is under review are now paying up to 250 basis points of sovereign risk premiums on ten year paper relative to the German Bund. Those hardest hit are appropriately known as the PIGS (Portugal,Ireland,Greece and Spain). The PIGS make the US look attractive if only by comparison causing funds to shift to the US Dollar/Treasury trade so the US dollar is now appreciating relative to the Euro breaking the Dollar down and Gold and EM currencies up momentum in their tracks.

Losses in the market value of European sovereign debt as well as the Dubai debt write downs in turn weaken European banks and in turn the European economy already fighting their trade problems with an appreciated Euro when capital fled from the US Dollar. The Dubai real estate based default that is trickling down to European financing banks is a reminder of the contagion that can be unleashed from seemingly isolated credit defaults (as with the subprime residential mortgage securities).

The Dubai credit event also brings back to center stage the fear that banking system will need to digest further commercial real estate and private equity loan losses for loans that mature between 2010 to 2014 without government backstops. That is, banking systems are now more vulnerable not just due to its book of loans but the effective removal of government financial back up due to the moral outrage that followed the repayment of TARP funds. That is, not many politicians will likely vote for TARP II if needed. The Dubai and the Euro sovereign debt risks remind us that we are not out of the woods of bank insolvencies, credit meltdowns which might account for the recent reversal in the market pricing of financials.

The credit problems of Dubai, the UK and the PIGS are not isolated events in that each has strong reverse momentum effects on the Dollar and commodities as each of these trades has heavy option positions betting their continuation. Hence if the price movement is reversed they will both be potentially subjected to significant trend reversal when the respective Dollar shorts and gold and commodity long positions must be covered. (See David Rosenberg,https://ems.gluskinsheff.net/Articles/Breakfast_with_Dave_121509.pdf ). Furthermore even greater threats to a correction from 2009 asset performance is possible because the Carry Traders are incented to unwind their carry positions financed from US Dollar sources when the Dollar is appreciating.
Hence, if the credit shocks in Europe gives the US Dollar/Treasury a new lease on life as the financial system’s flight to quality asset and elevates their prices, the carry trader who borrowed in the US and in turn sold dollars to be holding commodity currencies now have greater incentives to unwind their now riskier and potentially loosing bets if the correction in the US Dollar continues. A collapse of the carry trade will add to dollar demand and will further elevate the US dollar just as it contributed to its decline in 2009. It will also bring the commodity boom and gold boom under control.

These forces now favoring the US dollar have mixed effects on the V recovery. Foreign capital keeps interest rates low even if the Fed “exits” but it also removes some favorably V momentum in that we were just beginning to feel the benefits of a cheaper Dollar. Other countries were starting to outsource their production to the US given its relatively cheaper currency (e.g. Mercedes and Toyota).
All in all, foreign capital favoring your economy is a lucky reprieve in the third year of the Great Recession. The question remains will the actual V be up to the standards that have already been priced into the market.

If there is a shift in preference away from European and Middle East risk to the US Dollar/Treasury as the flight to quality asset, this generates significant shock waves to the price trends of 2009 created from the expectation of US sovereign default. On the other hand it could be on balance favorable to those betting on the V recovery and on those emerging nations that can grow on their own, with China the most obvious candidate.

Hence 2010 has the potential to experience Dollar strength and commodity weakness. In a sense we have caught a break from our fiscal troubles of financing the US deficit for a while but ultimately they are still there. Looking at the positive side of these developments, it looks like a buying opportunity is being created in foreign currency investments for countries that do not have acute fiscal problems.

The Bond Market Rocket and Fiscal Unsustainability Are On a Collision Path

The Spellman Report

Recently, the bond market has been in rocket mode. It has achieved liftoff and slipped the surly bonds of earth. And some believe it will keep going. The price of the U.S. Treasury 10-year bond recently reached an all-time high, generating yields at all-time lows. Moreover, the market yield on the British perpetual bond is reportedly at a 300-year low. Bond mania has even spread to the sovereign debt of Denmark and Singapore and others where negative yields exist. More astonishing is the ability of France to issue short-term sovereigns with negative yields!

The U.S. has eclipsed the record interest rates that prevailed when the 1930s Depression era came to an end with the onset of World War II, as shown in the chart to the right.

To get to the previous low yields of early December 1941, the U.S. economy had experienced a decade of depression with cumulative deflation of 30 percent. With that decade-long trend influencing expectations, the future seemed to call for more of the same. In that environment, investors favor long-term fixed income that appreciates in real terms as a result of deflation if the long bond is successfully paid and retired despite depression circumstances. Hence the asset category of choice in a deflationary depression is survivable high quality debt. In the ’30s, this also included surviving corporate debt that appreciated along with Treasuries, and the AAA-Treasury spread narrowed over the depression years.

Since we presently are in an era of Federal Reserve QEs, you might suspect that the Fed was possibly behind the rising Treasury prices and lowest yields of that era. However logical it might seem in today’s context, the Fed was nowhere to be found on the buy side of the Treasury market during the depression (something Bernanke seeks to not repeat). Indeed, the money supply declined by 30 percent over the course of the depression, so the bond market did it all on its own, without Fed support. Indeed, being in a pre-Keynesian world, the rationale or desire for manipulating the interest rate or credit conditions was not part of the Fed’s understanding of how to run a central bank.

Then as now, the private market participants price the expected risks and costs of holding a debt instrument over its life, and they require additional yield for each risk and cost they anticipate will materialize. They generally make this assessment of risk by extrapolating previous trends or by finding a similar historical episode to benchmark the likely gains or losses in value that might take place. Today we find many forecasts (even on this blog) citing the withering force of deleveraging due to over–indebtedness, which takes down an economy and softens demand and prices for goods. Hence, today’s natural historical model for bond pricing would seem to be the 1930s.

However, while there are similarities, there are also big differences. Today it is the government that is over–leveraged, whereas in the l930s it was the corporate debt sector which makes today’s long Treasury yields suspect. Though the economy is weak today, we are not in a decade-long depression, and while inflation is low, it is not in a cumulative deflation. And while the Fed held back this week, they still have a commitment to positive inflation.

The greatest difference is today’s checkmated body politic, which is unable to resolve an ultimately un-financeable Federal deficit. This week we had another episode of kicking the can down the road, with the agreement to run the debt meter another six months before facing the music. This is all in sharp contrast to a much lower government debt load and an obsession to run a balanced fiscal budget despite the depression that prevailed in the 30s.

While the growth/inflation profile is different in the two eras, it is more important to note the difference in long-term fiscal sustainability. Somewhere during the unfolding drama there will be an unspoken need (not mentioned in legislation or treaties) for the Fed to pull a “Super Mario” Draghi — who, last week, signed up to “do whatever it takes,” which apparently meant ignoring the ECB mandate and directly supporting Spain’s bank and government debt because the market no longer will.

Indeed, in the U. S. at the outset of WWII, the Fed presented the patriotic idea of wartime bond support to the Treasury, not the other way around. Central banks are not shy in the ultimate moment of money needs.

In what should be considered a “white paper,” the Fed’s role in these dire circumstances is recently discussed by Renee Haltom and John A. Weinberg in the Richmond Fed Annual Report, 2011, titled Unsustainable Fiscal Policy: Implications for Monetary Policy. In a rare Fed admission they indicate that “a central bank can reduce the government’s debt burden by creating inflation that was not anticipated by financial markets. Inflation allows all borrowers, the government included, to repay loans issued in nominal terms with cheaper dollars than the ones they borrowed.”

Indeed, if the Fed were to create inflation, it would not be totally unanticipated. This is the outcome seen by many observers, including Bill Gross of PIMCO.

And Bill Gross is not alone, as the bond-buying public seems to believe little of the fiscal sustainability story. Indeed, the flow of funds data, at least for 2011, indicates that the private sector purchased a minority of net new government debt issuance. Hence, private investors are not the leading purchasers of U.S. Treasuries, causing the all-time depressed bond yields. The graph indicates that the Federal Reserve is buying the lion’s share of net new Federal debt, and foreign investors are in second place. That market thrust no doubt represents a flight from European sovereign exposure, which is in a more advanced state of fiscal decay at the moment.

No doubt some have bought the1930s deflationary depression story as a model outcome to justify buying and holding sovereigns, but this time around it doesn’t lead to the necessary conclusion that sovereigns will appreciate from here. At today’s entry point of taxable low nominal yields and negative real yields, betting on both a deflationary depression with fiscal sustainability is not only a long shot but is mutually inconsistent.

A deflationary depression doesn’t generate government tax revenues to reach fiscal sustainability unless the voting public is willing to accept a substantial entitlement haircut. Moreover, if the low bond yields were to be maintained it would systemically cause defined-benefit pension plans to underperform. They would become forced sellers of sovereign bond holding to meet payouts — as is now finally occurring with Japan’s Government Pension Investment Fund.

The bond market rocket can glide for a time, perhaps years, until it collides with fiscal unsustainability. At that time it will be revealed plain enough for all to see when the private demand evaporates, much as it did with Spain this week. At that time, the U.S. Treasury is no longer a riskless debt instrument, nor is it immune from inflation.

(That being said, it leaves open the question of whether intentional inflation is bravado in the absence of bank lending, which will be addressed in a subsequent blog.)

When the market comes to understand that sovereign bond strength from a central bank is a mixed blessing — as it both purchases government bonds but also intentionally seeks to create “unanticipated” inflation —the bond market rocket is susceptible to the gravitational pull of Earth.

When that happens, there will be a large debris field for those who entered this untenable crowded trade (or stuck with it) so late in the game, supported not by the bond-buying public but only by a central bank wishing to do its patriotic duty — which includes inflation generation.

This indeed is not the 1930s.


If you enjoy this blog, please forward it to others who may be interested. Links to forward and sign up to receive are in the right hand column.

Budget Spin Control Undressed: Mike Granoff on the Government Financial Report

The Spellman Report

The White House makes projections of government deficits and debt accumulation such as contained in the Budget and the Economic Report of the President. Politicians being politicians thrive on good news and find ways to suppress the less flattering, better known as spin control. The spin control extends to making assumptions that generate favorable projections of future government debt and government debt accumulation so as not to further alarm a concerned electorate as well as the government bond market and financial insurance market (the CDS market) that is now pricing in US sovereign risk. The flattering assumptions for example, relate to economic growth that will provide tax receipts to the Treasury and will seemingly lighten the debt burden relative to income (see Sovereign Risk Part 2).

However, there is some accountability of Budget projections that the below blog by Michael Granof makes clear. There is a Federal Accounting Standards Advisory Board that he is a member of, that applies standards closer to but not to be confused with the Financial Accounting Standards Board that governs business accounting. When the FASAB rules are used some of the missing information from Budgets is filled in but without surprise we still get a general bleak picture of what lies ahead. Apparently, there was less room for verbal spin upon release of the Report so that the Treasury Department chose to draw as little attention to the release of the 2009 Financial Report as possible.

Released to Near Silence, the U.S. Treasury 2009 Financial Report Shows Dire Course

April 12th, 2010 · Opinion · Texas Enterprise · Top Stories · Posted by Dave Wenger

By Michael Granof, Guest Blogger for McCombs TODAY

Michael Granof is the Ernst & Young Distinguished Centennial Professor in Accounting at McCombs. He is currently serving a five-year term on the Federal Accounting Standards Advisory Board. The views expressed herein are his own, not necessarily those of the Board.

If you listen to certain politicians and talking heads you might get the impression that the federal fiscal sky is falling. Unfortunately, unlike Chicken Little, they may be right.

The Treasury Department recently issued the 2009 financial report of the United States government. Whereas there is lots of talk in Congress and in the press about the federal budget, the annual report was released to near silence. That’s too bad, not only because the annual report is untainted by creative accounting but also because its message is too important to ignore.

That message is that the sky is indeed falling.

No Creative Accounting

What is the difference between the budget and the financial report?

Most notably the federal budget is on what is essentially a cash basis. Contrast that to the federal financial report which is on an “accrual” basis and thereby recognizes revenues and expenses when they have their true economic impact, not necessarily when cash is received or disbursed.

As but one example, whereas the federal budget delays recognition of military pension costs until personnel retire and receive their payments, the annual report recognizes them as they perform their service. Similarly, the cash basis, but not the accrual basis permits the government to reduce expenses of a particular year merely by postponing payment of its bills from that year to the next.

These devilish machinations are possible in part because there are no established accounting rules for the budget or requirements that it be independently audited.

By contrast, the annual report is based on accounting principles established by the Federal Accounting Standards Advisory Board. The FASAB is an independent body of nine members, two-thirds of whom have no direct connection with the federal government. The report is subject to audit by the Government Accountability Office, an agency whose independence and integrity is almost never questioned.

To be sure, the accounting principles adopted by the FASAB are not beyond challenge. However, for the most part the criticisms relate to the basic financial statements, those that report assets, liabilities, revenues and expenses, rather than to the report in its totality. The complete report consists of scores of pages and notes, supplementary data and analyses. Data that critics charge are absent from the basic financial statements are almost always conveyed elsewhere in the report.

The 2009 federal balance sheet indicates that the government’s net position (total assets less total liabilities) is a negative $11.5 trillion, 12.3 percent worse than the previous year. But that’s just the tip of the iceberg. That negative balance excludes government obligations for social insurance programs, mainly Social Security and Medicare.

Whether social insurance should be booked as a liability has long been a controversial issue among government accountants.

On the one hand, it is argued that social insurance programs are like pensions. Participants pay into the plan and earn their eventual benefits while they are employed. Hence, both the expense for the programs and a corresponding actuarial liability, it is said, should be recognized during their working years.

On the other hand, some contend, social insurance programs are not – and were never intended to be – pension-like programs. Rather, like other entitlement programs, they are a tax and spend program in which resources get redistributed from one group of citizens to another. After all, when social security was initially established the first recipient, Ida May Fuller of Brattleboro Vermont, contributed only $24.75 but received $22,888.92 in benefits.

Unable to reach agreement as to whether social insurance should be included as a balance sheet liability, the members of the FASAB compromised, and thus, immediately following the balance sheet is a “Statement of Social Insurance.” In the 2009 annual report this indicates that the total present value of estimated social insurance expenditures over revenues is $45.9 trillion.

Hence, simple addition indicates that the total net position of the government is a whopping negative $57.4 trillion.

Similarly, the potential losses from investments in Freddie Mac and Fannie Mae are not included among the government’s liabilities. That’s because these entities are government-sponsored enterprises, not part of the government itself. Still, the report reveals that in an “extreme case scenario” the government could be on the hook for an additional $130 billion to satisfy existing loan guarantees – an amount that unfortunately seems trivial compared to the social insurance obligation.

We Have Been Warned

The message of the annual report is frighteningly candid. In a section of the report entitled Management’s Discussion and Analysis, which is intended to put the basic numbers into perspective, a multi-colored chart is entitled “Current Trends Are Not Sustainable Because Program Outlays Would Persistently Exceed Total Receipts.” (See below.)

Source: U.S. Department of the Treasury

It shows that, in the absence of policy changes, total government costs excluding interest will increase gradually from 19 percent of gross domestic product in 2014 to 25 percent in 2040 and 29 percent in 2080. Not surprisingly, rising health care costs is the major culprit.

Even more telling, another chart shows that if current policies are left unchecked U.S. government debt held by the public will increase from approximately 80 percent of GDP today to 700 percent in 2080 (when, one hopes, your children or grandchildren will still be alive). Correspondingly, per still another chart, net interest could rise from 1.3 percent of GDP in 2009 to 10 percent in 2040 and to 35 percent in 2080.

The federal annual report is 234 pages in length, and though some of the data are technical in nature, much is readily understandable by a layperson. There is virtually nothing in the report that a reasonable person would consider to be politically partisan. Indeed, in key respects the report is not much different than annual reports issued by the Bush Administration.

The message of the report is resoundingly clear. The federal government’s course is dire. Therefore, if, when the history of the current decade is written, it reveals that the American people and its representatives in Congress and the Administration failed to respond to the report’s warnings, then immediate future generations will have no doubt as to where to place the blame.

Financial Market Update: Treasury Yields and Inflation Expectations or is it Sovereign Risk as Well?

The Spellman Report

Financial markets and the Fed recently have been focused on prospective inflation. The issue at the Fed stems from the approaching April Open Market Committee meeting and a determination as to whether or not its low interest rate policy is creating asset bubbles and future inflation. The financial markets are similarly worried about higher inflation and the prospects that it will drive bond prices downward and market yields upward as occurred recently when the ten year Treasury temporarily went over 4%.

The ten year Treasury breaking the 4% mark caused a controversy among policymakers inside the Fed as well as among those in the financial market that are pricing fixed income. There are several dimensions to the controversy. First, did the rising 10 year Treasury yield signal that the markets believed inflation is on our horizon? Second, press interviews revealed there were several methods by which one answers the prospective inflation question. Is inflation based on excess money or is it based on the gap between Actual GDP and Potential GDP? And lastly, the Treasury breaking 4% raised the question of whether the financial markets have come to price in the risk that the US government will be stretched to the limit to fund its prospective future government deficits.

There are numerous theories of inflation causation and hence there is a difference of opinion regarding future inflation even when all possess the same information. Typically the range of expected inflation can be characterized by a tight normal distribution around some single digit inflation rate typically very close to the previous year’s actual inflation rate. “This Time is Different” is not only a recent book concerning sovereign risk but the title is appropriate to much of what is occurring these days and is especially applicable to inflation expectations. The Wall Street Journal of April 16 reports (Fed is Expected to Keep Rates Low for Now) that a survey of economists on the question of immediate inflation risk, 23 believed inflation would accelerate and 23 believed a slowing of inflation was a bigger risk hence, a bifurcated distribution of expectations. Much the same is coming from the Fed as some Fed bank presidents believe in monetary based induced inflation and others believe in the GDP Gap based deflationary forces (including Bernanke) and both camps are going public to justify their voting on the matter of Fed Exit.

This range of expectations arises out of the differences in the basic understanding of the inflation generating process. Here we are more than 30 years since the highest peace-time inflation rates of the l970s which was an event seeking an explanation. Many converted to monetarism at the time which became a lifetime obsession of checking the money supply growth as an indication of future inflation so when in 2008 the Fed more than doubled the monetary base almost overnight, the perceived natural law of MV=PY (assuming V is constant) lead those with monetarists inclinations to believe that a doubling of prices was about to occur. At the same time there were a few brave souls who looked at the same facts and came to the conclusion that deflation lay ahead and fixed income bonds with long duration were a smart buy.

What this group saw was an alternative analysis of inflation that rested upon the Inflationary or Deflationary Gap analysis that originated with Art Okun in the l960s. The “Gap” is the difference between actual GDP spending and the GDP that could be produced without straining the existing inputs of labor and capital. The supply based GDP is called Potential GDP which is consistent with labor and capital utilization that does not drive the scarcity and the price of inputs and hence cause firms to raises prices. One beauty of the Gap analysis is that it addresses both the demand side in the Actual GDP number which includes monetary and other influences on spending as well as the supply side that is subject to many of its own nuances such as oil prices, productivity, and labor force growth and so on. Indeed, during the winter of 2008-2009 it was a brave forecaster and money manager who went long, long term Treasuries on the basis of this theory in the face of the unprecedented money base increase. Lacy Hunt of Hoisington and Gary Shilling come to mind that had the conviction and courage to do so and moreover they went public.

Output Gap (deviation of real GDP from real potential GDP)

Now more than a year later Treasury yields have been increasing which has rekindled the debate both in the central bank as in the market place. The WSJ front page story “Inflation Fears Cut Two Ways at the Fed” describes an “intensifying internal Fed debate over the behavior of inflation … as the central bank plots an exit from an unprecedented experiment in easy money.” The story does us the favor of displaying the GDP gap that the long bond faithful pin their hope on.

As can be seen Actual GDP is well below Potential GDP though the Gap is narrowing a tiny bit. However, the deflationary gap with Actual GDP below Potential GDP is the excess resource zone and for excess resources to go away would depend on the strength of the GDP recovery. On that subject there are extreme differences of opinion as to whether the recovery will be V, U or W shaped and a strong V is needed. Certainly the graph gives one the impression that we are years away from Actual GDP gaining the momentum to again penetrating Potential GDP and place the economy into the inflationary gap. None the less, markets price the anticipation of future events and if the rising 10 year Treasury yield is due to inflation expectations Mr. Market is getting a very early start. There is some precedent that has lasting effects. In the tech bust, an economic bottom occurred in 2002 and by May, 2003 inflation risk pricing returned to the 10 year Treasury market well in advance of the actual event.

Given all this optimism that a rebounding GDP will overrun Potential GDP there still are other credible reasons for long Treasury prices to decline. US sovereign risk is likely being priced given the contagion of Greece to all developed world sovereign debt. Furthermore, the recently passed health care legislation is also a candidate to have stirred concerns for the financing burden of Treasury debt and the potential for a monetization in future years. There are other credible explanations as well for the rising yield on the 10 year Treasury. A flight to quality among country sovereign debt yields occurred as the Greece problem drove capital to the US in early 2010. (Will 2009 Financial Market Trends Hold Up in 2010?)Some of that capital might be returning the Europe now that IMF support seems to be building for a Greece bailout. There is yet other mega shift explanation of the market yields rising. It could be an indication that the Chinese have become net sellers of Treasuries over the past four months and China’s bailout of the Treasury market has possibly run its course now that China is running a trade deficit and is facing normalization of exchange rates.

In any event if the financial market blips of this week are indeed the beginning of a trend to normalization of both the economy and financial markets and a sufficiently strong economy to generate inflation, fixed income managers need to have a plan as to what assets that conform to client mandates will not result in negative total returns. The alternatives would likely lay in short maturity debt that is rolled over as it matures which gives the money manager the ability to ride interest rates up without taking a market loss on principal. Other alternatives are floating rate debt or foreign debt from an environment that is not likely to inflate or face sovereign risk.

The Inflation and Interest Rate Cycle: Rewriting the Script

The Spellman Report
Lew Spellman, The Spellman Report

Since World War II, economic observers have been trained to expect rising inflation and interest rates as the economy begins to grow out of a recession. The typical sequence would unfold like this: employment growth (measurable in a reduced unemployment rate) would be followed by relative labor scarcity, resulting in wage growth. From there the script calls for generalized inflation as producers attempt to maintain their profit margins by raising the prices of their output. Thus, rising demand results in a climbing inflation rate, which in turn sets off other reactions that lead to higher interest rates.

As this traditional recovery unfolds, businesses seek to expand production in a more receptive growth environment. This in turn leads to an increase in the demand for loans to finance that expansion and producers become more willing to pay higher interest rates to obtain credit in a rosy environment. Lenders, in turn, take this opportunity to require higher interest rates to compensate for declining real returns when holding fixed-rate securities when inflation occurs.

The central bank then gets into the action and stokes higher interest rates in its role as the designated guardian against inflationary outcomes by raising the rate at which it lends short-term funds to banks. In the “good old days,” this also meant slowing down the rate at which it purchased securities with fresh new money so banks would have less to lend.

As seasoned market observers and investors, we have seen this movie before. We’ve come to expect demand growth to spark the same sequence of reactions, from wage growth to inflation growth to higher interest rates and then a Fed reaction. That is the general profile of an economic recovery, but it is not the story of the current one, which is well on its way to a surprise ending.

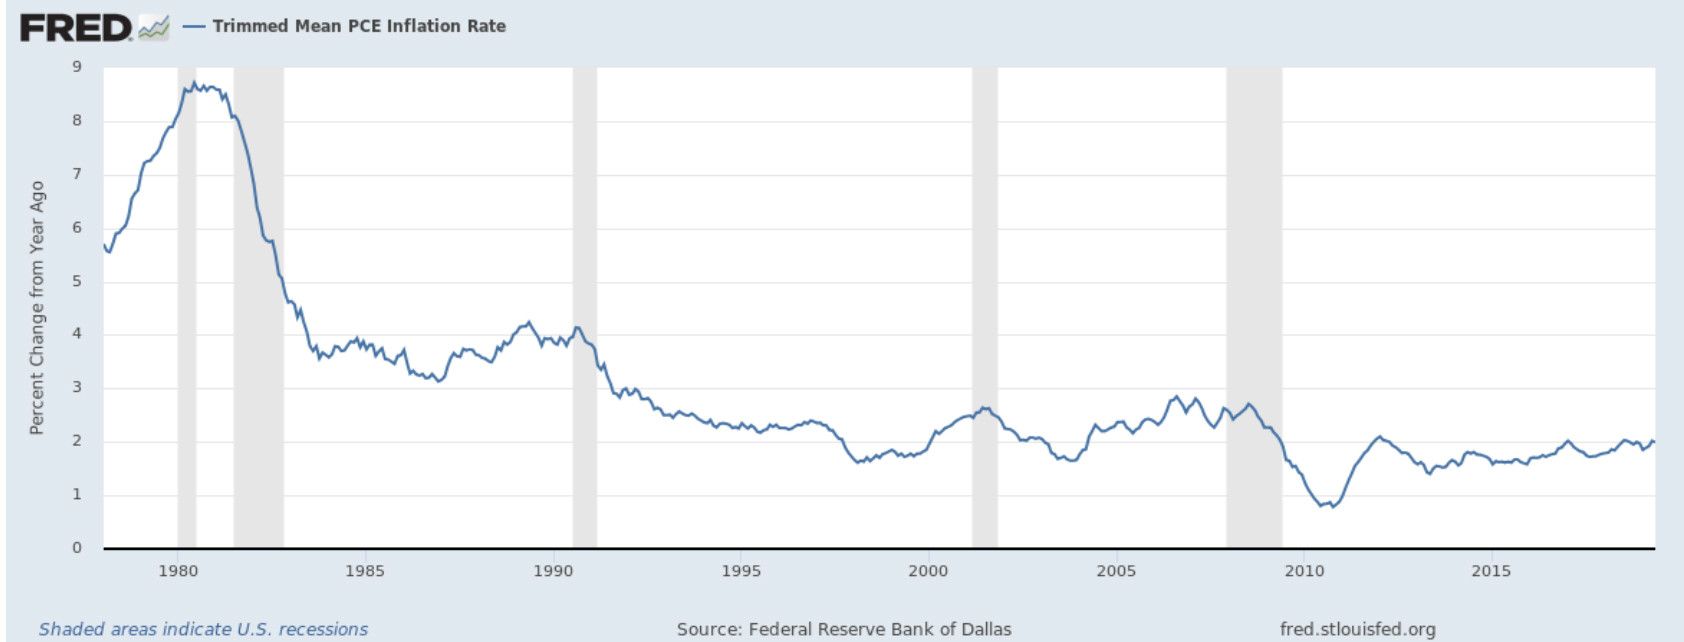
As it stands now, the economy is in its 10th year of expansion, with diminutive increases in inflation and interest rates, particularly longer-term market rates are cascading downward. Of course, this lengthy expansion with relatively little inflation (shown below) is partly attributable to its genesis occurring in the lowest lows of the Great Recession, with a large supply of unemployed labor on hand. But ten years is roughly three times longer than the typical demand-driven recovery.

While the usual inflation and interest rate increases of bygone recoveries have not been totally absent in the present one, but their occurrence has been very muted — and now these trends appear to be headed in the other direction.

The US inflation rate over this recovery has struggled in the decade since the recession, not quite reaching the 2% threshold that the Fed has stated would be its upside tolerance to inflation. But given the extreme monetary accommodation during the Great Recession, the Fed thought it wise to get a head start on reigning in the economy.

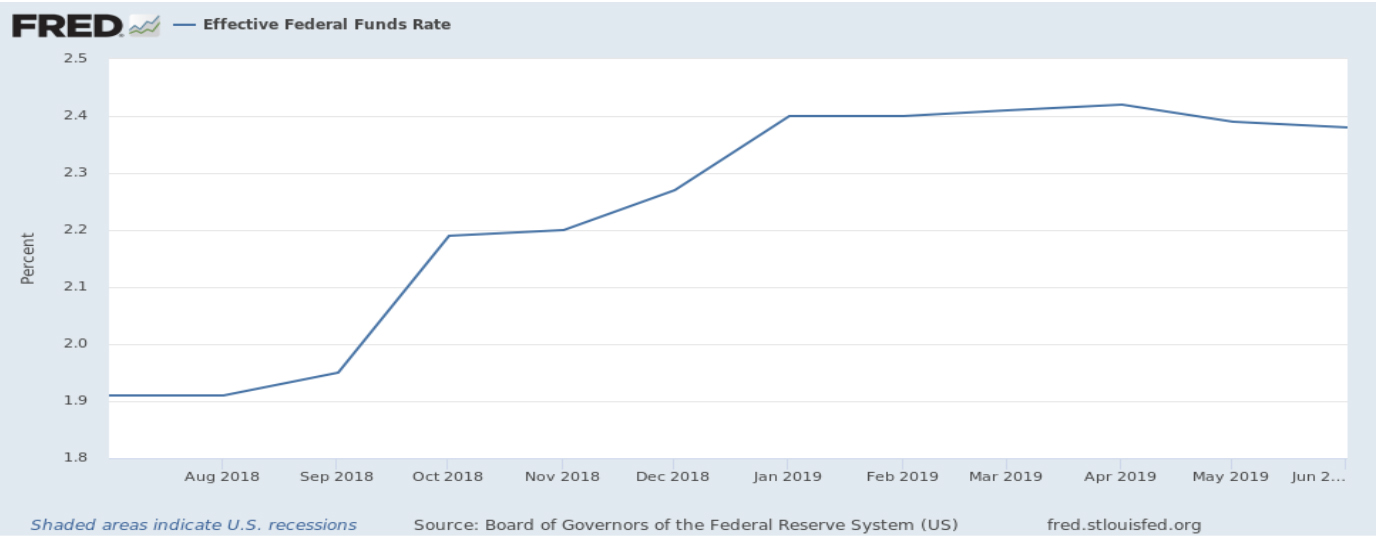
So, in anticipation of the usual growth/inflation reaction to an up-cycle, the Fed turned toward higher interest rates well in advance of inflation’s occurrence, as shown below. It increased the policy rate that it charges banks for overnight liquidity very gradually for the last three and a half years and conducted an unprecedented net asset selling program to offset its bloated portfolio it had accumulated under years of Great Recession QE.

But just as they were getting into the zone of intensifying their response of higher policy rates, a funny thing happened. Last October, after the Fed’s ninth small bump in its credit offering rate was followed by large scale private purchases of fixed income securities on the secondary bond market. This very substantially LOWERED longer-term government bond yields at this late stage of the economy recovery. That is, the market rates were moving in the opposite direction than of the Fed.

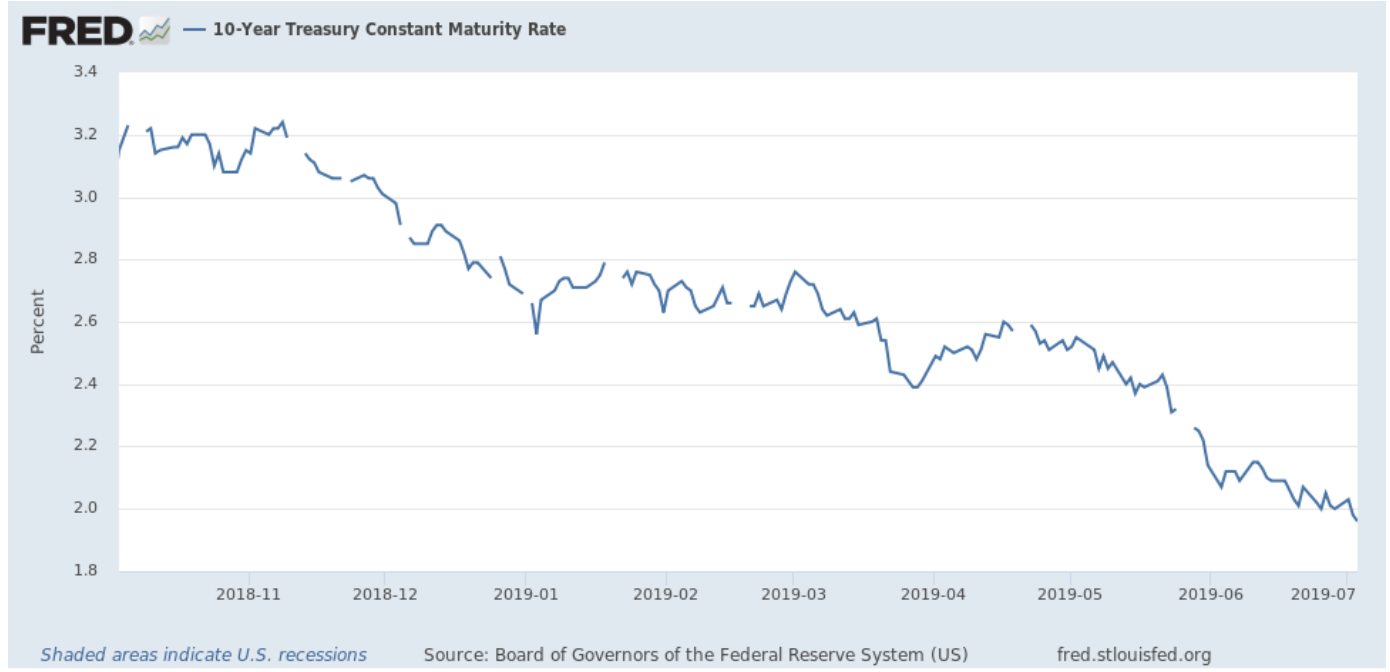
Indeed, the 10- and 30-year maturity treasury bond yields plummeted as a result of a bond buying binge, as can be seen below for the 10 year maturity. For example, the ten-year treasury yield fell from near the 3% level to 2%. This is a rate that is below the market yields during the deflationary times of the Great Depression of the 1930s. The same can be said for the 30-year treasury yields falling below 3%.

More recently, the momentum of the recovery has lost some zip and the Fed announced that it is now leaning toward cutting rates rather than raising them. It turns out they don’t need to bother, as the market rates — especially of the longer-maturity instruments — have declined dramatically without any help from the Fed since the time it raised policy rates last October.

What could be at operation in an economy that grows and does not set off much inflation and interest rate plummet?

As it turns out, we don’t need much more than one word to account for these changes to such well-established, cyclical reactions to an economy growing out of a recession. That word is “globalism”.

On the inflation front, reduced trade barriers open the playing field to least-cost producers on a global basis who are not reliant on US domestic resources when they become scarce and expensive. The inflation rate pressures have moderated as the U.S. increasingly turns to imported goods made from the cheapest inputs from elsewhere.

Globalism also accounts for why interest rates are falling in the US even as the Fed attempted to raise them. This is because globalism has been applied not just to trade flows but also to capital flows. That means capital from abroad no longer locked up behind capital outflow barriers can and will gravitate to the US capital markets if US rates are higher.

And indeed, they are because the sluggish European economy caused the European Central Bank to vigorously returned to negative interest rates when their economies softened in 2019. The combination of lower market yields in Europe than in the US and an open capital spigot has allowed foreign private investors to shift funds to the US debt markets which offered substantially higher yields than are available in Europe.

In June, we witnessed the largest monthly purchases in history of ETFs containing US Treasury bonds. No doubt, many of those buyers were European private institutional investors hunting for yield in order to cover their institutions’ financial obligations.

And so, it turns out, in this brave new world of globalism, other central banks such as the ECB have a great deal of influence on U.S. interest ratesas capital from abroad is incented to flow to the highest yields and when it does it lowers those yields.

From here on out, open global economic and financial markets will continue to reshape cyclical responses. As a result, there is less inflation and interest rate vulnerability to a strong US cyclical recovery.

Many onlookers — including the Fed, financial newsmakers, academia, investors and Wall Street in general — now need to revise their thinking as the reactions to a US economic expansion have changed.

The Inflation Divide

The Spellman Report
The economy is on a tear. There are many “next new things” coming to the marketplace, generating private investment to produce new goods that are in high demand. Firms that invest are seeing gains in after-tax corporate profit, thanks to expansionary fiscal policy from tax cuts and accelerated depreciation on new capital goods. There is also increased spending on military. And don’t forget deregulation, which is enabling businesses — especially small businesses — to thrive.

But the economic expansion has many observers spooked by the fear that booms will inevitably turn into busts, “just as they have in the past.” So today there is a growing chorus of observers expressing nervousness about the implications for economic and financial market performance. They do have a case to argue, as there is an endogenous mechanism that can turn an economic and financial boom into a bust. So how likely is that?

Here is the script — you decide whether to extrapolate it.

When spurts of demand growth outpace labor force growth (as is occurring now), labor becomes relatively scarce. Efforts to increase output further translate into employers paying premium wages to attract workers. This occurs when there is a very small labor pool that remains on the market, so wages almost have to rise. And if wages grow faster than labor productivity (that is, if you are paying more and labor is not producing more), there is an increase in labor costs per unit of output.

In the next step of the “boom-to-bust” chronology, employers seek to raise product prices so as not to compromise their profit margins as labor costs rise. In addition, demand growth — driven either by the next new thing or the next new government spending program — exacerbates supply-side shortages. The higher input prices then spread to other inputs including energy, transportation, raw materials, financing costs, etc. As producers attempt to pass along the cost increases into higher product prices, it sets in motion classic “cost-push” inflation.

This is a dramatic change in the environment following the weak, drawn-out, nine-year recovery from the Great Recession. The civilian unemployment rate is now 3.8%, a low last seen at the end of the decade-long expansion of the 1960s. The current situation is that job openings exceed available labor, and the quit rate is at an all-time high, indicating that labor is gravitating to higher-paying jobs. What a startling change from the struggles of the past decade.

The economy is responding positively to a myriad of next new things (and/or government-provided new things) against a backdrop of heroic monetary expansion during the Great Recession, followed by deregulation, tax cuts, incentives to repatriate corporate capital held abroad, and heavy-duty investments in military and transportation. The demand side of the economy is now doing its part.

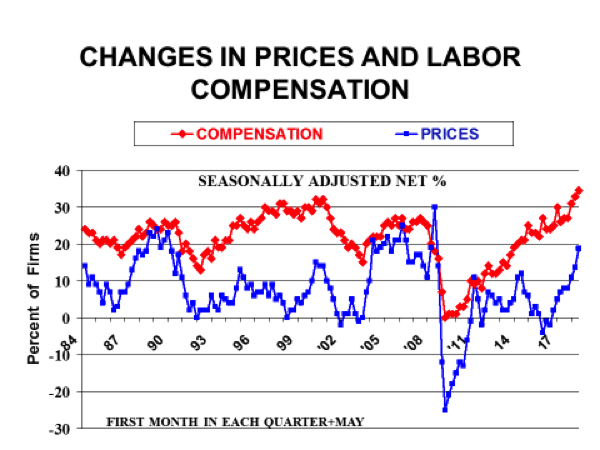
Labor compensation at small and independent businesses has been steadily increasing for the last few years, and now prices of goods are also increasing. The graph below, from the National Federation of Independent Business’ monthly small business survey in May, illustrates this trend: the percentage of participating firms that are raising prices (shown in blue) is growing alongside the portion of firms that are increasing compensation (shown in red). It should also be noted that the consumer price index rose 2.8% for the year ended in May, a trend that has started to make the bond market and the Federal Reserve uneasy. We have now crossed the inflation divide.

Other tidbits of encouragement provided in the Overview of Small Business Trends are equally eye-catching:

“The Index of Small Business Optimism increased significantly in May to 107.8, a large gain of 3.0 points. This is the second highest Index reading in its 45-year history.

  • Reports of compensation increases hit a 45-year record high.
  • Views about expansion are the most optimistic in survey history
  • Reports of positive earnings trends at a survey record high
  • Reports of positive sales trends are the highest since 1995
  • Concerns about labor quality second highest in survey history
  • Reports of price hikes the highest since 2008 (Oil $140/bbl.)
  • Plans to raise prices are the highest since 2008.”


At this point, it’s safe to say the Great Recession is behind us and the concern has shifted to the ramifications of higher inflation. This in turn sets off reactions.

First, the higher inflation rate will cause the financial markets to change course when it becomes clear that it will continue.

In an inflationary environment, investors reduce the amount they offer for bonds or other investments where the derived income is a fixed amount. Or to put it another way, bond investors only invest if the fixed yield they receive is increased to compensate for the loss of purchasing power from expected future inflation.

Expectations of rising inflation thus reduce investors’ willingness to hold bonds; indeed, bonds funds have recently experienced net redemptions and a decline in the market price of bonds.

Bonds are not alone, as the market multiplier of a dollar of income from other financial streams will similarly adjust downward — though downshifts tend to be less pronounced if inflation contributes to the income stream. (This typically occurs with stocks and real estate, which ride through inflation with less resistance.)

From there, the rise in inflation causes the central bank to tighten, which is usually done through some combination of bond sales and higher interest rates charged on loans to its bank clients. The central bank logic is that higher interest rates are a disincentive to purchase goods that require financing, thus containing the demand side of the economy so as not to further overrun supply.

But these days, with so much debt expansion as a result of the Fed’s Quantitative Ease during the Great Recession, higher interest rates serve to increase debt service on existing debt when it faces refinancing at higher market rates. I have seen estimates in the area of $100 billion annually of added debt service in the offing. This amount would be roughly ½ of 1 percent of GDP — a large but not insurmountable drain on income that would otherwise be spent.

But the bigger concern for veterans of past booms and busts is the sense that with all that debt on the books of consumers, businesses, and governments, what follows are defaults and losses to the entities holding the defaulting debt. Those often have been banks, which are then assaulted by depositors in a panicked run.

In the housing boom, financing was extraordinarily concentrated in loans for residential structures, with homes being the collateral. By the time the housing boom reached its zenith, overbuilding in the housing sector significantly reduced the market value of the houses that served as collateral on bank loan portfolios.

There will be far less financial system vulnerability this time around, as there isn’t a similar concentration of financing to a single overbuilt industry. The closest over-expanded and over-financed sector is consumer auto loans, which would be considerably less of a debt drag. Much has changed since the last financial crisis. Banks have rebuilt their capital and liquidity to meet far higher safety standards. Indeed, the largest 37 bank holding companies — which hold 80% of total banking system assets — recently passed the regulatory stress test for capital and liquidity against a worst-case default scenario.

To be sure, there will be losses to holders of defaulting debt if there is another “big one” — but these losses will be spread out, making the overall system less vulnerable to a repeat of a financial crisis a la 2008.

All in all, the game-changer right now is the ripple effect from the inflation generated by the recovery. The cost of financing purchases will become more expensive. Financial assets will generally be marked down if their income streams don’t keep pace with inflation. Enlarged debt service will drain income growth without decimating it. All this occurs on the other side of the inflation divide.


SaveSave

Economic Direction as Seen Below the Radar

The Spellman Report
The financial press’s take on the economy and financial markets has lately been cloudy. The growth rate has indeed been drifting and the economy is being subjected to adverse shocks. But let me suggest there is good reason to believe there is a positive direction emerging below the radar of the cross-currents.
One way to reveal patterns of growth is to break down or decompose economic time series into long-term secular trends, cycles and shocks, which take on a pattern of random noise. Since the noise sells newspapers, it receives the lion’s share of daily attention, and it can also cloud the economy’s overall sense of direction. Certainly, the recent plethora of shocks — whether tapering and then more tapering, the emerging market sell-off, Obamacare’s attendant ripples, or adverse winter weather — can create a sense of economic drift or even contraction.

But it seems to me that more important cyclical forces are unfolding below the radar, moving the economy so slowly that its movement is barely detectable.

When I say cyclical forces are moving the economy, I mean that they have a life and momentum of their own apart from the shocks and the secular influences. That is, economies slipping downward don’t go to zero, and economies moving upwards don’t go to infinity. Growth sets in constraints — which typically are overinvestment in durables and plant and equipment — indeed leading to an absence of investment in the recession that follows.

Similarly, during times of recession, a backlog of deferred replacement for capital goods occurs and is ultimately fulfilled. This is true whether the capital goods or durables are those of the consumer, business or even the government.

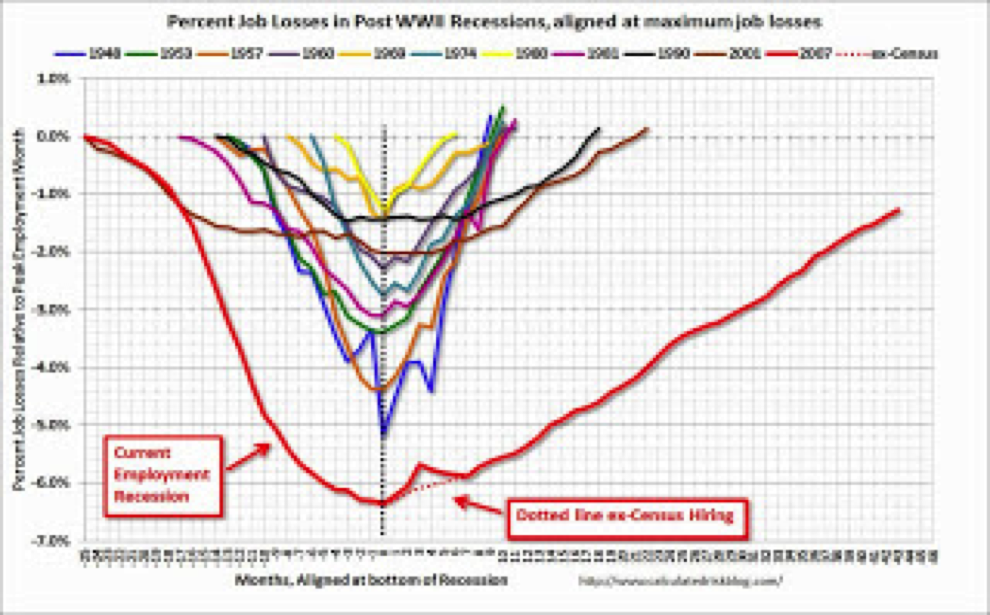
The below graph depicts the duration and amplitude of U.S. employment cycles during the last 70 years or so. The graph reveals that when the economy goes down, so does peak employment from the previous cyclical high. The depiction of cycles is centered on the cyclical employment bottom, which is measured relative to the number of months since the beginning of the recession.

As you can see, most of the post-WWII cycles were relatively short and mild compared to our current episode (shown in red), which is still struggling to return to peak employment six years later. The current recession is a long-bottoming-out saucer that stands out from the much shorter and shallower post-WWII business cycles. The graph shows how the current “recovery” has been slow-moving but nonetheless persistent.

Easier and cheaper money has been the usual driving force that lifts the economy out from a cyclical bottom. In the first wave, it stimulates consumer durable spending, including housing after an absence of durable replacement. This revival has already occurred in the U.S., causing a bottoming out of our current great saucer.

The typical second wave of a cyclical recovery is business investment spending on plant and equipment, which kicks in after demand rises faster than the supply side is expanding. The usual pattern is that business meets higher demand levels first by adding labor, which becomes more expensive as it becomes scarce.

The availability of skilled cheap labor in the U.S. is becoming constrained due not just to rising employment levels but also to an unprecedented drop-out factor in labor participation. Furthermore, much of the globalism movement of the past 30 years (i.e., moving production to countries with large pools of cheap labor) has pretty much run its course.

In that situation, the recessionary lag in business investment spending tends to kick in, driving the next phase of a cyclical expansion.

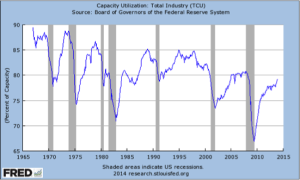
The usual benchmark for this to occur is when industry capacity utilization reaches 80 percent — and U.S. total industry utilization is now knocking on that door at the 79.2 percent level.

capacityFurthermore, most of our emerging market competitors’ utilization rates are above those of the U.S., so the expansion of the capital goods industries is likely to be a global phenomenon.

Basically, there has not been a capital expenditure boom since the tech go-go years in the late 1990s, and the capital equipment we do have is aging, with an estimated life of 22 years (up from a more usual 19 years.

Much like my 1999 Pathfinder of the tech year vintage, it has physically worn out, and the usual capital goods replacement phenomenon has me reaching for my wallet. But in that regard the business sector is cash-rich like never before, so the usual obsessing over interest rate elasticity of investment spending is less relevant. If it were relevant, rates are low enough.

Indeed on the financing front, a great deal of financing occurred last year via the non-bank banking sector on top of retaining earnings for years during the recession. To the extent that the Ma and Pa shops did not get in on last year’s financing bonanza, the commercial banking system is showing signs of loosening up credit six years after the shockwaves of 2008, and banks should again become relevant for them.

So basically we are at the point where the baton to keep this race moving forward is in the hands of business cap spending, as consumers are showing signs of constraints in paying for more expensive health care.

The other missing sector that has not been heard from (or at least is not making a lot of noise) is the gradual removal of the net export drag. Available domestic energy is a very positive and long term “shock” to the system.

So cap goods spending, which disappears in recession, reappears at about this juncture of the business cycle, fortified by physical obsolesce, a shortage of skilled labor, and ample cash on hand.

Will this be a typical business cycle recovery? Well, there is nothing about this recovery that is totally classical, as it’s been a classic all to its own. But this fundamental impetus from deferred demand for capital goods stands a high probability of being realized to keep the ball rolling forward.

Moreover, despite governments at all levels attempting to get their fiscal houses in order, there is also a deferred infrastructure demand that will pressure the replacement if not the expansion of the existing roadways across America that are in critical neglect.

While there is good reason to believe that the current cyclical movement will continue into its next phase, one must realize that as employment grows and labor markets become tighter — especially for the skills needed for today’s plant and equipment — labor costs tend to rise as a percentage of the corporate top-line revenue leaves a thinner margin of corporate profits.

So we get into the anomalous territory where growth continues but profit margins and total profit growth decline. So the growth of the economy and the growth of profit diverge at this juncture as an aggregate number, but the focus on the growth industries in this environment makes this a stock-pickers market — unlike last year, when the broad indices outperformed the economy.

As a last note: Cost-push inflation often creeps into this second stage of a cyclical recovery, which causes fixed-income prices to decline in the later portions of cyclical patterns. We should anticipate much the same to happen again, which makes inflation-sensitive income streams more valuable at this juncture.


Sign up to receive the Spellman Report. Bracing financial and economic insight. Now with free delivery!

The Knockout Punch: Has America Turned to Socialism?

The Spellman Report
In the days following the election there was a numbing silence. It was as if the body politic was dazed by a heavyweight champion’s blow to the head. It staggered and sought clarity to understand what’s to become of our future. Even the 24/7 financial market / economic blogosphere went silent in contemplation.

What began to emerge from the cobwebs was a trickle of semi-coherent commentary of what was learned in the 1930s. Was it again a New Deal tilt toward socialism? References to past classicists such as Von Mises, Hayek, and H.L. Mencken were everywhere. Ayn Rand’s Atlas Shrugged sold more than 1.5 million copies since the first Obama election — a startling comeback for a 55-year-old work of fiction — and sales are again soaring. It has also spawned a series of film adaptations.

A realization set in that Obama’s victory in 2008 was not a one-off reaction to the George W. Bush presidency. Rather, it validated the notion that the U.S. was now a left-leaning democracy in the European style.

If there were any doubts, as the first order of business by Friday of election week, the president asserted that the election was a referendum revealing that Americans want taxes to increase for the wealthiest citizens but not anyone below the $250,000 income level. In his words, “Nobody — not Republicans, not Democrats — wants taxes to go up for folks making under $250,000,” he proclaimed. The definition of the bad guys has hardened.

While a very good case can be made for all taxpayers to pay more, apparently the imperative to redistribute income was more important than the goal of growing jobs and the economy or containing the fiscal deficits.

The question is whether the goal to redistribute and regulate is a shift in fundamental American values or merely a reflection of the president’s own agenda.

While a morphing of the American willingness to redistribute is a socialistic ideal, it is also possible that the redistribution reaction to events that began to unfold in the early 1980s and could even be nearing its end.

At that time, the globe was bifurcated into the developed world (the U.S., Europe and Japan) and a large number of countries that fell into the category of Less Developed Countries (LDCs). There were extreme differences in wages and income per capita.

With wages differing between the developed nations and the LDCs — in some cases with a ratio of 100 to 1 — producers naturally would gravitate to the ultra-low-wage countries. But there was a catch: Tariffs deterring “cheap” goods from entering the high wage countries needed to be dismantled.

At first, exports to the developed world proceeded in a trickle as producers sought cracks in the tariff structure, but such vast cost differences would lead to creative means of dismantling trade barriers.

The major break in protectionism of goods to high-wage countries came in the form of multi-country treaties to systemically eliminate trade barriers among countries.

NAFTA broke the ice and the post-WWII efforts to lower tariff barriers — the General Agreement on Tariffs and Trade — was replaced by the more effective World Trade Organization (WTO) with membership leading to a phasing out of trade barriers. Even Russia, the latest of more than 150 WTO participating nations, pledged to open trade and the momentum continues with a proposed U.S.-EU free trade agreement making headway.

As trade opened and production and jobs gravitated to the low-cost producers, new terminology was invented. Off-shoring and globalization meant that LDCs were “emerging” and then “developing.” All in all, Ross Perrot was right in his great debate with Al Gore. There would be a “Giant Sucking Sound” of jobs (and income) gravitating to the low-wage countries.

Of course, as the process of globalization unfolded, wages in the formerly ultra-low-wage countries have subsequently risen while those in the U.S. have declined, leading to a convergence of labor costs across countries. We are not at absolute convergence, but enough movement has occurred so that the U.S. is not as relatively expensive a place to produce any longer. While the exportation of jobs is not over, we are beginning to see the end of the tide going out and a trickle of the tide coming in (see: Made in America Again).

This is a process economists call Factor Price Equalization. That is, wages (the price of labor in all countries free to trade) eventually meet in some middle ground given the incentives to shift production to the cheapest source.

How does all of this relate to the election and socialism? The distribution of income in the U.S. got fatter in the two tails: those made poorer by being forced to get in line with the ultra-low-wages competition, and those with capital or skills that could not easily be duplicated abroad, which were made richer. The two tails in the income distribution end up fighting it out through their respective presidential candidates.

But globalism has also significantly eroded the middle class and shaped the election result.

According to an August 2012 Pew Research Center report, “half of American households are middle-income, down from 61 percent in the 1970s. In addition, median middle-class (real) income decreased by 5 percent in the last decade, while (middle class) total wealth dropped 28 percent. According to the Economic Policy Institute, households in the wealthiest 1 percent of the U.S. population now have 288 times the amount of wealth of the average middle-class American family” — making that a less-than-ideal group from which to select a presidential candidate.

The trends of globalization, wage convergence and the declining numbers and income of the middle class have been in process for almost the last 40 years, which is largely attributable to declining wage income. Moreover, wage income as a percent of total income has declined by about 10 percentage points. This was an enormous reduction in the labor’s share of the income pie and accounts for the middle class decline.

However, to compensate for this loss of income over the same period, transfer payments by governments as a share of the income pie has increased by 10 percentage points, as shown in the accompanying graph.

Since there is no free lunch, the transfers known today as entitlements needed to be financed somehow. The two logical options for addressing this issue were to tax and redistribute corporate profits or to redistribute from the president’s targeted group. Given the political stand-off in our body politic, the expeditious means to sooth the labor income shortfall was to borrow on the credit of the U.S. and subsidize via transfers or entitlements. As a result, the Census Bureau reported that 49 percent of American families receive at least one government benefit.

So here we are in 2012, and the ability to continue compensating for the loss of wage income by borrowing and transferring has hit up against funding limits due to baby boomer entitlements coming due. The cookie is crumbling, but the election indicates the middle class still wants its cookie — and the ability to borrow someone else’s cookie and pass it around has reached an un-financeable end. We have three choices: take a cookie from “rich folks” and pass it around, grow the number of cookies, or realize there will be fewer cookies. The redistribution argument won at the ballot box.

Personally, I don’t see Obama’s reelection as an enthusiastic validation of a socialistic ideal but rather a vote to sustain labor’s income share — but functionally it makes no difference.

As Forbes contributor Bill Frezza summarized it: “America has now hurtled past the dependency tipping point … and an electoral majority happily voted for itself unlimited benefits that will supposedly be paid for by a productive minority — until that productive minority starts eyeing the exits.”

Since blatant redistribution squashes incentives to produce and grow, the incentive to redistribute also grows. Once headed down that slippery slope, it takes dire circumstance, not a threat of dire circumstances, to cause a rethinking and a redirection back to free market capitalism.

China went all the way down the slippery slope. With economic misery as a result, in the late 1970s Deng Xiaoping asked the question of how to provide more food as its state-owned farms didn’t adequately feed the population (despite 82 percent of the population working in agriculture). The “reform” was to allow state farms to sell and retain the proceeds of its agriculture production in excess of its socialistic quota. Look what incentives did for China. She has never looked back and likely is now more capitalistic than the U.S.

In the election, Obama prevailed despite receiving 10 million fewer votes than he received in 2008. This was no apparent landslide for socialism. But the outcome was also a result of a Republican dialog that failed to demonstrate how making cookies includes a reward for the wage-earning middle class.

Both the message and the messenger were off key, and as a result we could be headed down that same slippery slope that might not be reversed until there are not enough cookies to go around. It could be generations before “reform,” such as in China, prompts us to reconsider entrepreneurs and the fruits of entrepreneurship. At that time, they would once again be considered heroes rather than villains but that could be far down the road.

If you enjoy this blog, please forward it to others who may be interested. Sign up to receive the Spellman Report. Bracing financial and economic insight. Now with free delivery!
[send-link-to-friend]

Second Anniversary of Credit Meltdown: A Faith Based Rally

The Spellman Report
Today is August 3, 2009. It is the second anniversary of the modern day version of Black Monday. Two years ago today, financial markets started a meltdown. That, in turn, brought down the financial institutions that held the assets that were melting down and in turn, shortly thereafter, brought the economy down to its knees as well. We are now in the seventh quarter of a recession which is the longest post World War II recession, a recession now called by economists “The Great Recession.” The good news is we managed to avoid a Great Depression. The way we managed to avoid that is some very aggressive Federal Reserve purchases of financial assets as well as some very aggressive, unprecedented government purchases of assets, as well, called the TARP program. Between the two aggressive programs, we saved or stopped or avoided or averted the continued meltdown of financial assets and financial institutions, but it also generated a great deal of concern over future inflation as well as the financial viability of the US government.

About two weeks ago, the Fed, in a very masterful, tactical stroke, started to recapture expectations of inflation that it generated. The way they did this was to have an unprecedented Town Hall meeting that was nationally televised to talk about “their exit strategy.” Their exit strategy means we are going to contract all the lending we have been doing and also, in doing so, we contract the monetary aggregates so that there is no fear of inflation ahead. Basically what they did was recapture inflation expectations. Also, what occurred in the discussion of their exit strategy was a presumption that an exit strategy could occur because the economy is somehow healed at this point. So it generated expectations of reasonable price activity as well as a recovering economy. The stock market responded to that and added to a rally that had already been underway since early March. In fact, in July, the stock market probably had one of the strongest Julys on record. We now are in somewhat of a quandary as to what all this means, in that we are having a stock market recovery but yet the economy is floundering.

What is the stock market trying to tell us? Or, moreover, what is the mindset of investors who are investing in the stock market and what might we be possibly anticipating and contemplating as stock investors? Well, typically a stock market advance is based on a forecast, a forecast of where the economy is going. The forecast of where the economy is going is typically supplied by 75 or so professional forecasters typically working for stock brokerage firms who approximately semi-annually forward their forecast to the Wall Street Journal, which then tabulates the mean or the average of the forecasters’ forecast and publishes it. This typically is a nonevent in that the forecasters typically do not do anything more than extrapolate past trends. There is a decent reason for doing so, and that is the economy is a great momentum machine and that is if there is production taking place today, those who produce those products will be paid income, and then we can very much count on them spending virtually all of it so that production generates income which produces spending. In turn, the spending produces the next stimulus for production, income generation, spending. So around and around we go with production, income, spending, production, income, spending. The only way that stops is that there is some kind of a sharp loss of confidence and the spending stops, as indeed occurred in 2007. So it is very easy for the economists to simply trend extrapolate the past forward. Given the trend extrapolation forward of the economic growth rate, then stock market analysts very faithfully project forward firm revenues and firm profitability into the future and come up with their forecast of stock price valuations. At the core is the future projection of the economy which ironically is based on a trend extrapolation of the past.

Now we are in a dilemma for forecasters and the stock market. That is that we have had seven consecutive quarters of negative economic growth. If that gets projected forward, we are pointing toward a GDP of zero, which cannot happen, and stock prices of zero, which cannot happen. So our forecasters had to abandon the trend extrapolation method and actually start thinking about it for the first time. What has occurred instead of one single forecast of extrapolation of growth, what has occurred are two separate forecasts of the future, two different groups of people with two different totally directional forecasts. One is rosy and the other is glum. The rosy forecast typically is made by those who are stock market participants either as stock brokers, money managers, etc. Their experience since 1946, and they have a long period of history to look at to have confidence, is that since 1946 the Fed has been mandated by law to intervene and save the economy from recessions. The usual mechanism as occurs today is very low interest rates and the availability of credit. The Fed can, in turn, count on us as consumers or investors borrowing from banks and then spending. So it has been a very reliable mechanism. The Fed monetary policy has been a very reliable mechanism to prevent recessions from continuing at great length. In fact, over the last 25 years prior to the current event, the two minor recessions we have had were extremely short-lived and very quickly reversed. So given that history of successful manipulation of the economy by the Fed, the stock market analysts and stock market investors and the stock market industry forecasters are very confident of a rosy future, particularly after such a sharp drop that did occur in financial prices. Basically, since January, both debt and equity prices have risen not only in the United States, but across the world.

So that is one forecast. The other forecast that you also hear, which puts us into dissonance as stock investors, is the hard core group of realist economists who look at the current economic situation and see it as being very different from any economic situation we have been in before. They see the slippery slope of economic recovery and really are not confident of economic recovery occurring anywhere in the immediate future. Most of them see it being a “U-shaped recovery” with no exact idea of how long we will be in the bottom of the U. Very plausible cases can be made that we are still going down, credit is still contracting and delinquencies are rising, commercial real estate in particular, so the process of wind down is still occurring. They do not see any immediate end to it.

So what we have now are two loud and clear groups with two different forecasts. One is of a rosy, bright future with a positive forecast of economic growth and the other Doom-and-Gloomers see that the economy, if not continuing to contract, at least will sit at a very low level of activity for a prolonged period of time.

What does one do as a stock market investor? Which of these two schools of thought do you take as comfort for whether or not to enter into the stock market advance at this point. Or, if you have, whether to stay there? Basically, the stock market train started pulling out of the station on, I believe, March 2, and now it has picked up momentum in July. Most of the major indices have increased somewhere in the order of 40-45%. So the question becomes the anguishing decision of a stock investor as to whether to jump on the train at this point when there is a very logical case that could be made that we will have a train wreck ahead. So what does one do? Basically, what we have on one hand is a faith rally. Incidentally, what the rosy-eyed optimists have observed is not just that the Fed saves us, but that in the past the stock market has always advanced forward before the economy has advanced. They feel they can be rosy in their outlook without any indication of economic advance because that is not necessary for a stock market advance. On the other hand, the other group has to see some firm foundation of economic advance to generate spending, to generate firm revenue, to perpetuate increase in profitability.

So we now have this dilemma. Which of these two forecasts to believe in and act upon? It is a difficult situation, an extremely difficult situation, because what we have had is a situation where expectations of the rosy future really have departed from the reality of a rosy future. What does one do? The faith-based rally is based on confidence of the future and has gathered more fuel in July because so many stock analysts had to jump on the train because basically their job is at risk if they somehow under-perform the market. They have underperformed very badly the last two years and three years in a row. Typically is the formula to be fired. We have had more fuel thrown into the faith-based rally and the doubters are becoming more doubtful. It becomes an excruciatingly difficult decision to make for stock market investors. All that I can say is that rather than examine the underlying economy which we can presume not to mend itself in any significant way over the next year or two, take a look at the market fundamentals of the strength of the rally and how much more funding the enthusiasts have to throw into the market and to bid prices up. That has occurred. It has occurred very significantly in July, where institutional cash has been reduced significantly, short positions have been reduced significantly. In fact, one can make the case that this is to some extent a short covering rally.

So the market fundamentals will have to be examined very carefully right now, more so than the economic fundamentals. I think we can take as a given that the economic fundamentals are weak. The question is are the stock market fundamentals weak or strong. What I mean by that is will prices continue to advance on high volume. That is probably the most significant indicator of where the market goes from today. But meanwhile, I have really no answer to the question as to which camp to join. The problem is if you really are a pessimist, as indeed I am, how does one jump on the train at this point where you see the possibility, and the strong possibility, of continued problems ahead. It is a very frightening experience, as I say, and the only thing you can use as a guide is current financial market technicals. That is something to pay attention to if you do care to jump on the train.

Receive The Spellman Report Monthly for Bracing Economic and Financial Insight


Click to Subscribe Now

Follow The Spellman Report

Click to Email Dr. Spellman
Tweets by spellmanreport
Lew Spellman

Lew Spellman is Professor of Finance at the University of Texas McCombs School of Business. The Spellman Report seeks to interpret current and future trends in the economy and financial markets from the perspective of history, theory and policy.

Other Commentary

Frank Beck, Beck Capital Management
Bill Gross, Janus
The Grumpy Economist
Jeffrey Snider, Real Clear Markets
Ben Bernanke
Hoisington Management, Economic Overview

RECENT POSTS

  • The Inflation and Interest Rate Cycle: Rewriting the Script
  • The Goose that Laid the Golden Egg and Nobody Wants It
  • Is it Risk or Uncertainty?
  • The Recovery from the Great Recession is over. What Happens Next?
  • The Anniversary Blues
  • The Trump Tariff Offensive
  • The Inflation Divide
  • The Debt Boomerang
  • At the Cross Roads of Money and Inflation
  • The Bitcoin Mania

POSTS BY TOPIC

Disclaimer: The Spellman Report is not an offering for any investment. It represents only the conclusions and analysis of Professor Lewis Spellman. Any views expressed are provided for information purposes only and should not be construed in any way as an offer, an endorsement, or inducement to invest.
© 2018 The Spellman Report
↑